

UPDATE: Kaiser study proves it: ACA markets had stabilized until Trump's wrecking ball crashed into them
Thu, 05/17/2018 - 10:12am
The Kaiser Family Foundation just released an important new study which proves everything I've been saying for the past year and a half: After years of turmoil, the ACA-compliant individual market had finally quieted down and reached equilibrium last year...right up until Donald Trump, combined with total GOP control of the federal government, deliberately came in like a wrecking ball and messed everything up again:
Concerns about the stability of the individual insurance market under the Affordable Care Act (ACA) have been raised in the past year following exits of several insurers from the exchange markets for 2017, and again last year during the debate over repeal of the health law.
In this brief, we look at recently-released annual financial data from 2017 to examine whether recent premium increases were sufficient to bring insurer performance back to pre-2014 levels, when new ACA insurance market rules took effect. These new data from 2017 offer further evidence that insurers in the individual market are regaining profitability, even as political and policy uncertainty, repeal of the individual mandate penalty as part of tax reform legislation, and proposed regulations to expand loosely-regulated short-term insurance plans cloud expectations for the future.
Analysis: Individual market insurers in 2017 had their best year financially since the ACA’s guaranteed coverage for people with pre-existing conditions, but future outlook is uncertain
...We use financial data reported by insurance companies to the National Association of Insurance Commissioners and compiled by Mark Farrah Associates to look at the average premiums, claims, medical loss ratios, gross margins, and enrollee utilization from 2011 through 2017 in the individual insurance market.1 These figures include coverage purchased through the ACA’s exchange marketplaces and ACA-compliant plans purchased directly from insurers outside the marketplaces (which are part of the same risk pool), as well as individual plans originally purchased before the ACA went into effect.
There are several graphs included, but this one is probably the single most telling:
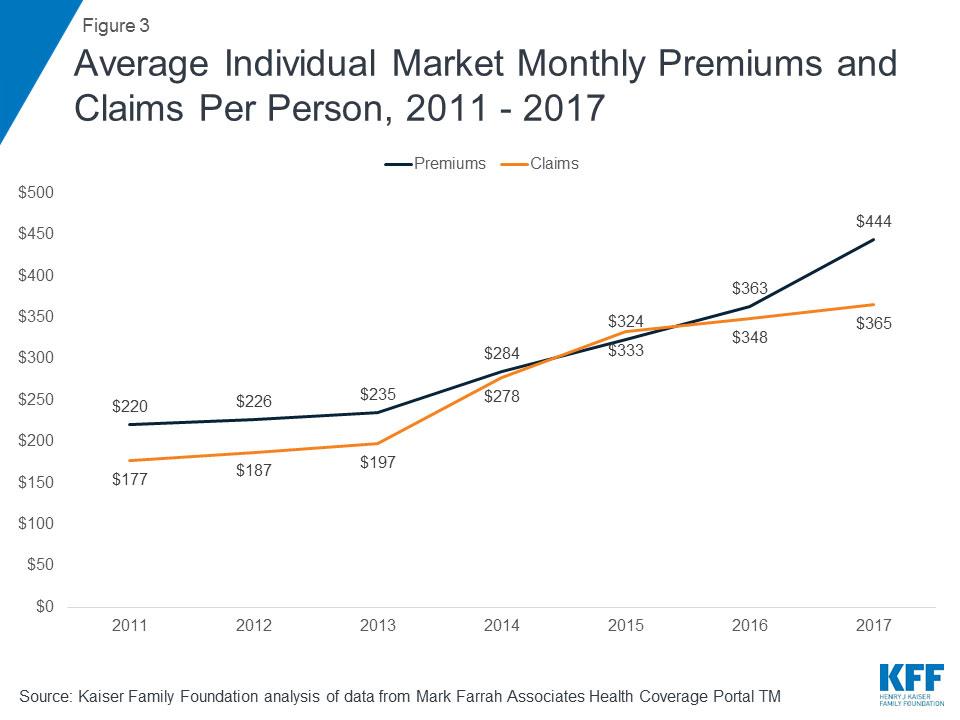
The light line is the average claims, in dollars, from the entire individual market. All data for 2011-2013 is for non-ACA plans, of course; for 2014-2017, the vast bulk of it is ACA-compliant, although I assume a decreasing portion of it is non-ACA compliant each year due to the inclusion of grandfathered and grandmothered enrollees. As a reminder, as of 2017 non-ACA plans were likely down to about 10% of the total market, so their downward pull on the overall average has been dramatically reduced over the past 4 years.
Notice how in the pre-ACA market, individual market claims made up roughly 80 - 84% of total premiums...that is, the carriers had a 16-20% gross margin before operational expenses. Since the ACA's 80% MLR rule went into effect a few years before the policies themselves had to be fully ACA-compliant, that makes sense.
Then, in 2014, the exchange plans launched and all newly-sold individual market plans had to be ACA compliant...meaning they could no longer deny coverage to people with pre-existing conditions, could no longer base premiums on their health/medical condition, had to start providing all 10 Essential Health Benefits, could no longer impose annual or lifetime limits on claims, and had to put a cap on the enrollee's maximum out-of-pocket costs.
Obviously this caused claims to increase substantially as millions of previously-uninsurable people flooded the market. Claims, which had previously been going up about 5% per year in 2012 and 2013, shot up 41% in 2014.
The carriers had known that medical claims would go up dramatically, so they raised their average premiums to try and cover the increase...but they simply undershot the mark: Verage premiums only went up 21%. Result? Collectively, the carriers were operating on a 2% margin before their own expenses.
In 2015, the second wave of expensive enrollees hit, with claims going up another 20%, while the carriers were still scrambling to figure out how to adjust. They only raised premiums by around 14%, meaning that in 2015, they ended up losing 3% on the individual market before they even took operational costs into account.
Misjudging their 2014 rates was understandable given that their entire playbook had been thrown out and they were effectively flying blind. In 2015, you might think they should have figured it out...but keep in mind that 40% of 2014 enrollees didn't even start their policy coverage until April or May due to the first Open Enrollment Period lasting six months (six and a half, really) and having a botched launch, meaning enrollment was seriously backloaded in March/early April 2014.
The carriers were setting 2015 pricing over the summer of 2014, which means they normally would use the most-recent full year's worth of data to work with...but in this case, that would have meant 2013 data, which of course was still useless. Instead, they only had anywhere from 2-6 months' worth of early 2014 numbers, which doesn't make for a very reliable base to work with.
In 2016, they finally had a full year and a half's worth of ACA-landscape data to work with (all of 2014 and half of 2015), and were finally getting on top of their pricing problem: They raised rates around 12%...while at the same time, after two years of dramatic claims increases, they dropped right back to their pre-ACA average of 4.5%.
Result? Premium averages lifted back over claims averages, giving carriers a 96% MLR. They had pulled out of their tailspin.
Finally, in 2017, they had gotten their ducks in a row: Claims once again only rose by 4.9%, while the 22% average premium spike finally pushed most carriers back into an ~18% average gross margin...exactly the same range they were at before the ACA exchanges launched.
One of the other charts makes this same point:

So, what does this mean? Well, for one thing, it means that if not for the massive sabotage efforts of Donald Trump and the GOP in 2017, 2018 premiums would likely have only gone up by around 5-10% at most. The pre- and post-spike trends were around 5% each year. This year there was another ~2-3% one-time bump due to the reinstatement of the ACA carrier tax (which had been "holidayed" for 2016 & 2017). My own estimate is that around 11% of the 29% average spike this year is due to non-sabotage factors, so there's still another 3-4 percentage point discrepancy, but that could be due to a variety of things.
The other key thing to note is that for all of the GOP's shouting about "Obamacare caused rates to more than double!", it's clear from this data that even if you disregard various sabotage efforts before 2017, ACA regulations themselves were only responsible for about a 67% hike over a 4 year period.
How do I know this? Let's assume the only ACA regulation which had been put into place was the 80/20 MLR, without guaranteed issue, community rating, EHBs, etc etc. If that had happened, and the 5%-per-year claim trend had stayed consistent, claims would likely have been something like this:
- 2013: $197
- 2014: $207
- 2015: $217
- 2016: $228
- 2017: $239
In other words, 2017 premiums would have likely have gone up at least 21% anyway...meaning premiums would likely have gone up at around the same rate, reaching around $285/month in 2017. That means that of the 89% average 4-year premium hike (from $235 to $444), only about 3/4 of it can be "blamed" on the ACA itself.
OK, that's still a significant hike...but that's where the larger philosophical debate over the trade-off comes into play. In return for unsubsidized enrollees paying $159/month more for their healthcare policies, millions of people with pre-existing conditions no longer have to fear being uninsurable due to their circumstances, and millions of people no longer have to worry about having to declare personal bankruptcy due to medical expenses.
The problem, of course, is that if you're unsubsidized, that extra $159/month can be a killer...and for many people it's a lot more than $159/month. In addition, the subsidy formula itself is still not robust enough for a large number of people who recdeive them...which, of course, is exactly why I've been pushing so hard to remove the 400% FPL subsidy cap and beef up the APTC/CSR subsidy formula.
So, what about next year? Well, I'm still in the early stages of my 2019 Rate Hike Project, but the early data makes it look like something like a ~22% overall average unsubsidized increase, with perhaps ~14 points of that (2/3 of the total) being due specifically to the GOP's repeal of the individual mandate combined with Trump's expansion of junk plans.
Put another way, if not for Trump/GOP sabotage in 2017 and 2018, I'd expect 2019 premiums to be somewhere around $520/month ($444 + 8% + 8%).
Instead, they'll likely be pushing $700.
UPDATE: Oh wow...Dave Anderson of Balloon-Juice reminded me of another important point (which is actually referred to in the Kaiser study as well, but which I skipped over):
And we need to caveat further. This graphic does not make any adjustments for the termination of Cost Sharing Reduction (CSR) subsidies. If CSR was paid normally through the end of the year, MLR would have been lower than the actual 82%
In 2017, following relatively large premium increases, individual market insurers saw significant improvement in loss ratios, averaging 82%. Though 2017 annual loss ratios are impacted by the loss of cost-sharing subsidy payments during the last three months of the year, this is nevertheless a sign that individual market insurers on average were beginning to stabilize in 2017, better matching premium revenues to claims costs.
2017 rates were too high if we were to assume no major morbidity shocks to the risk pool.
As a side note, we should expect to see some more MLR rebate checks being cut this fall for 2018 as well as a lot of MLR checks getting cut in the fall of 2019 as the CSR compensation rate hikes were being added onto a base that was too high already for the underlying claims experience.
Here's what both Kaiser (actually, Cynthia Cox, Ashley Semanskee and Larry Levitt) as well as Dave are referring to:
Most people (well, most people paying attention to ACA policy) understand that 2018 rates were jacked up a good 14-15% or so on average to compensate for CSR payments being cut off by Donald Trump last fall.
HOWEVER, what many people either don't understand (or forgot about, as I briefly did this morning) is that CSR payments were actually cut off for the last 3 months of 2017 as well.
2018 premiums were set in the summer/fall of 2017, so most carriers were able to scramble and set their rates accordingly.
However, 2017 premiums were set in the summer/fall of 2016, long before Donald Trump was elected, and thus the carriers didn't anticipate CSR payments being cut off the following year. When they set their 2017 rates, the CSR load issue wasn't a factor...yet, as Dave points out, most of them still inadvertently overshot the mark for 2017 anyway.
In other words, collectively, they overshot 2017 rates, by sheer coincidence, to be almost the exact amount that they would end up having to eat in CSR cut-off losses in the last 3 months of the year. Amazing.
Dave's point here is that if Trump hadn't cut off CSR payments, 2017 rates likely would've been about the same...but the rebate checks showing up this year would be even larger.
Advertisement
