

The real reason why the Koch Brothers hate the ACA in a single graph.
Tue, 03/20/2018 - 4:44pm
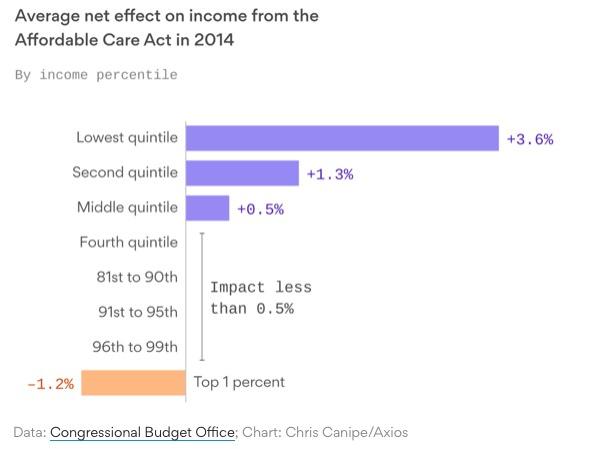
It's not about healthcare. It's not about "freedom". It's not about "tyrrany". It's not about "choice". It's about a tiny cadre of absurdly wealthy plutocrats being upset about a tiny fraction of their hoard being used to help out the least-fortunate among us. Via the Congressional Budget Office (graph via Axios):
Distributional Effects of Major Provisions of the Affordable Care Act in 2014
Together, CBO estimates, the provisions of the ACA that were in effect in 2014 boosted household income, on average, for those in the lowest quintiles, and reduced income for households in the highest quintile—particularly for those in the top 1 percent. Those provisions affected both means-tested transfers and federal taxes and consequently had direct effects on the distribution of household income. 19 In addition to the provisions that were implemented in 2014, two major revenue provisions went into effect in 2013: a tax on net investment income and an additional Medicare payroll tax. With all major provisions that were in place in 2014 taken into account, households received approximately $56 billion in new means-tested transfers or refundable tax credits and paid an additional $40 billion in new taxes tied to the ACA (see Table 1).
Expanded Medicaid Eligibility. The largest change in means-tested transfers in 2014 was the expansion of Medicaid eligibility.21 That provision increased federal outlays for the Medicaid program by $38 billion.22 Most of those outlays went to lower-income households. Almost a third of those benefits were provided to households in the lowest income quintile, and more than a quarter of the benefits were provided to households in the second income quintile.
Insurance Subsidies. Subsidies to purchase nongroup health insurance for low- and middle-income households affected the distribution of both means-tested transfers and federal taxes. Cost-sharing reduction payments to insurers are federal outlays and are counted in this report as means-tested transfers.23 Premium tax credits, on the other hand, are refundable tax credits, which means that they lower federal revenues and often increase federal outlays; if the amount of a refundable credit exceeds a filer’s tax liability before the credit is applied, the government pays the excess to the filer. In the federal budget, those payments are counted as outlays. Here, however, the entire premium tax credit is counted as a reduction in federal revenues.
In 2014, the federal government spent $3 billion on payments for cost-sharing reductions. Almost 40 percent of those were provided to households in the lowest income quintile and another third went to households in the second income quintile.
Premium tax credits totaled almost $15 billion in 2014 and provided benefits to households further up the income distribution. More than a quarter of those credits went to households in the lowest quintile, a third went to households in the second quintile, more than a fifth went to households in the middle quintile, and about 10 percent and 5 percent of the tax credits went to households in the fourth and highest quintiles, respectively.
New Taxes and Penalties. The revenue provisions that initially went into effect in 2013—the net investment income tax and the additional Medicare payroll tax— placed a combined burden of almost $30 billion dollars on high-income households in 2014. For tax filers with high income, the first provision imposed a 3.8 percent tax on net investment income, and the second, an additional 0.9 percent tax on earnings above a certain threshold. The burden of those two tax provisions fell entirely on households in the upper half of the highest income quintile but primarily on households within the top 1 percent of the income distribution.
Another provision of the ACA levied an annual fee on health insurance providers beginning in 2014. In total, health insurance providers paid the federal government $8.6 billion as a result of those new fees. CBO allocated the new fees to households in proportion to the value of their employment-based health insurance premiums. On that basis, the burden of those health insurance fees was relatively skewed toward higher-income households— about 40 percent fell on households in the highest income quintile, and another quarter fell on households in the fourth quintile.
Another revenue provision of the ACA with direct effects on the distribution of household income was the individual mandate penalty, which required tax filers without adequate health insurance coverage in 2014 to pay a penalty when they filed their taxes. For 2014, households paid approximately $2 billion in individual mandate penalties. The distribution of tax filers paying the penalty was relatively evenly spread across the income distribution, although the largest share of the burden fell on the middle quintile, and the smallest share fell on the lowest quintile.
Overall Effects. The combined effects of the major provisions of the ACA considered in this report made household income more evenly distributed. Overall, households in the lowest income quintile received additional resources as a result of that law, whereas households at the very top of the income distribution paid a significant additional amount in taxes (see Figure 2).25 In 2014, households in the lowest and second quintiles received an average of an additional $690 and $560, respectively, because of the ACA, CBO estimates. In contrast, households in the highest quintile paid an additional $1,100, on average, because of that law.26 Most of the burden of the ACA fell on households in the top 1 percent of the income distribution, and relatively little fell on the remainder of households in that quintile. Households in the top 1 percent paid an additional $21,000—primarily because of the net investment income tax and the additional Medicare tax.
On a percentage basis, relative to income before transfers and taxes, the additional income received by households in the lowest quintile was much larger than were the negative changes in income for households in the top 1 percent. The ACA increased income among the 24 million households in the lowest quintile by about 3.6 percent. In contrast, the average of $21,000 paid by households in the top 1 percent decreased their income, on average, by 1.2 percent.
Advertisement
