

Early Projection: Who'd Do the Silver Switcharoo? Quite a Few! (~1.0 million nationally?)
Tue, 02/06/2018 - 5:05pm
Now that the 2018 Open Enrollment period is officially over in every state +DC, I've started compiling more detailed demographic breakouts of the data on a state-by-state basis. The official CMS report from the Assistant Secretary for Planning & Evaluation (ASPE) report should be released at some point in the next couple of weeks, but until then, I'll have to settle for whatever reports I can patch together from some of the state-based exchanges.
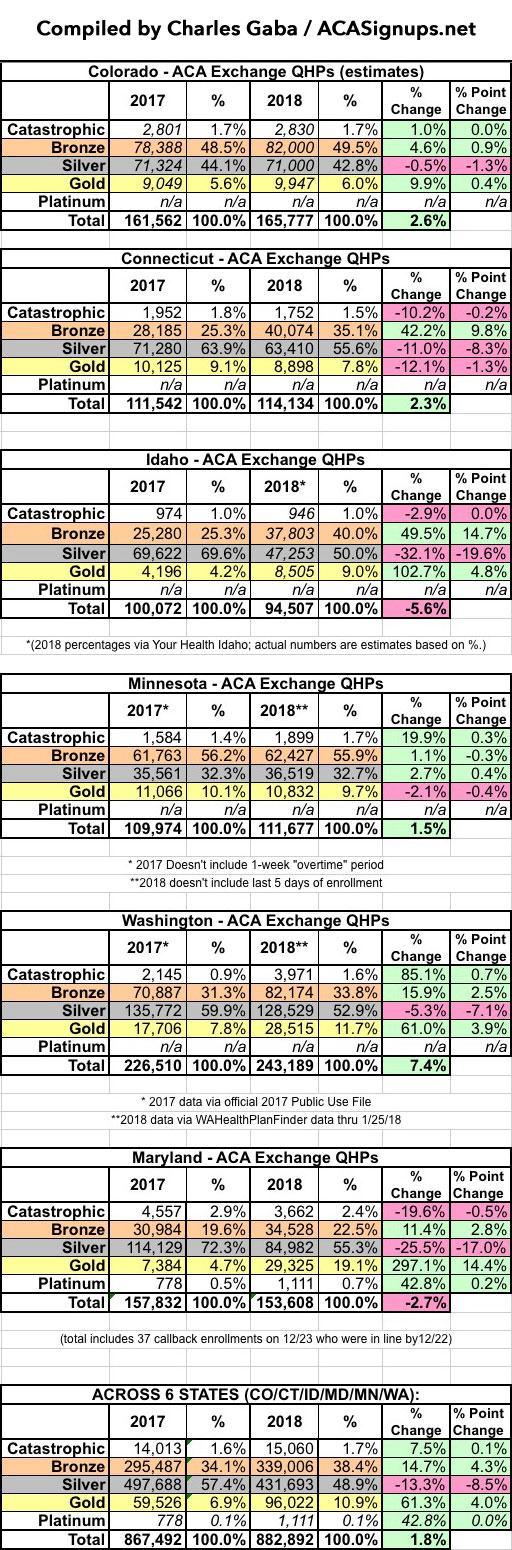
So far I've dug up final (or near final) data for six states: Colorado, Connecticut, Idaho, Maryland, Minnesota and Washington State. Collectively, these states only represent about 890,000 2018 exchange enrollees, or roughly 7.5% of the 11.8 million total, so I have no idea how representative they are nationally, but it's all I have to work with for the moment.
The type of demographic data available varies greatly from state to state, but a major data point available from all six of them also happens to be one of the more interesting points, especially this year, given the " CSR Silver Loading" gambit available in most states this year.
There's actually about 8,000 enrollees (total) missing from a few of the states below, because some of the data doesn't include the final few days of Open Enrollment, but overall it should be pretty accurate; I highly doubt the relative metal level selections shifted around enough to make more than a nominal difference.
Of the six states, as expected, Colorado and Minnesota saw the least-significant shifts. Colorado went the "broad load" route, so the CSR cost was spread fairly evenly across all metal levels. Minnesota, meanwhile, did "Silver Load"...but due to their BHP program, has very few people receiving CSR assistance to begin with, so there's not much of a financial load to be spread out anyway. In fact, while a few days are stll missing, it looks like Silver plans increased their market share slightly in MN.
The other four states, however (CT, ID, MD & WA) all show substantial Silver Load/Silver Switch effects:
- In Connecticut, Bronze plans increased 42%, stealing away nearly 10 points from Silver (as well as a bit of Gold, oddly enough)
- In Idaho, Silver plans dropped by nearly 1/3, with Bronze plans sucking up most of them while Gold picked up the rest.
- Washington State only saw a 7 point drop in Silver, with Gold increasing dramatically and Bronze to a smaller extent. Oddly, Catastrophic plans increased by 85% as well, although their numbers are so small that this is oversized percentage-wise.
- Finally, Maryland saw the most dramatic Silver Load/Switch effect: Silver plans are down 25%, while Bronze plans increased by 11%...but check out Gold plans: Up a whopping 297%, nearly a 4x increase over last year! Also noteworthy: Platinum plans increased 43% (Maryland is the only one of the 6 states to even offer Platinum, and like Catastrophic Plans, the numbers are misleading due to the small numbers involved).
Finally, I added all six states together to see what the blended metal level changes look like. Platinum is an outlier since only one state even offers it, but otherwise the story seems pretty clear: Silver is down over 13% (8.5 percentage points), with a little over half of those enrollees downgrading to Bronze and the rest upgrading to Gold.
Again, I have no idea how representative these six states are nationally, but assuming they are, that suggests that around 8.5% of the 11.8 million total exchange enrollees...or around 1.0 million even...upgraded or downgraded from Silver to Gold or Bronze.
Advertisement
