

UPDATE: OE5 state-by-state breakout (semifinal edition)
Tue, 01/09/2018 - 8:44pm
UPDATE 01/15/18: Since I originally posted this, the deadlines for 2 more states have passed (CO & MN), and I have minor, non-final enrollment updates for MA, MN, DC & WA. Everything in this post has been updated accordingly, including the table below.
UPDATE 01/16/18: Updated table and writeup to include final Colorado numbers, which just came out today.
UPDATE 01/17/18: Updated table & writeup to include final Maryland numbers, which just came out today.
As I keep stressing, the 2018 Open Enrollment Period is still going on across 6 states 4 states 3 states (+DC). Colorado's deadline is Friday night. Minnesota's is Sunday, followed immediately by Washington State on Monday. Eight days later, Massachusetts closes the books on the 23rd. Finally, eight days after that, OE5 officially ends for the last three state-based exchanges in California, DC and New York State.
Maryland and Connecticut just posted their final numbers (a couple percent behind and ahead of last year respectively), but otherwise things are likely to be fairly quiet on the ACA exchange side until then, so this seems like a good point to post a semi-final breakout of the state-by-state numbers to see how they compare against the 2016 and 2017 Open Enrollment Periods. Obviously this table will likely change once the numbers for the final state-based exchanges are plugged in.
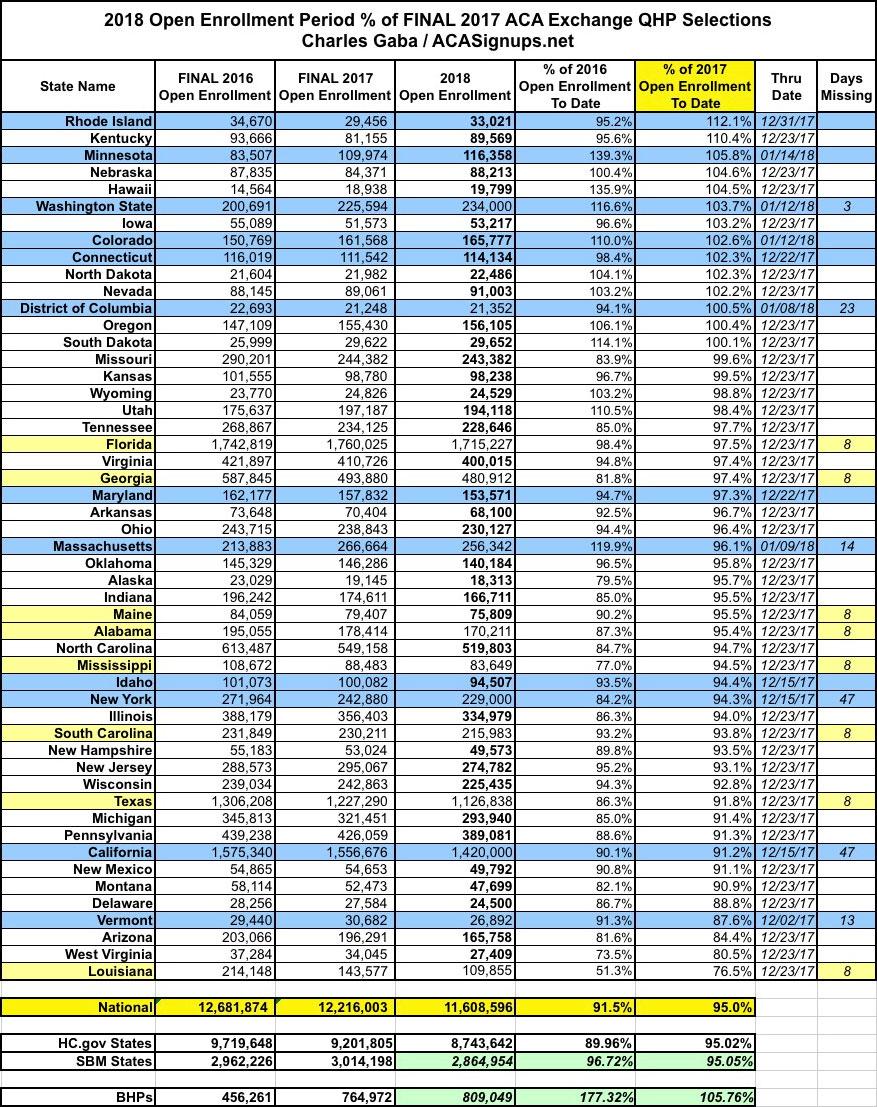
HealthCare.Gov ended up exactly 5% behind last year (which in turn was 5.3% short of the previous year). Considering the shortened deadline, lack of outreach/advertising and so on, this is actually pretty damned good all things considered. There will likely be a small number of HC.gov enrollments tacked on via the hurricane Special Enrollment Periods in 8 states from 12/24 - 12/31, but those are likely to be pretty nominal; I can't imagine they'd bump the tally up by more than a half a percent at most.
The state-based exchanges, meanwhile, are currently 5.7% 5.4% 5.0% behind last year...but again, seven of them are still enrolling people for up to three more weeks, and aside from that, the enrollment data is missing from as far back as December 6th (the DC exchange holds their monthly board meeting tomorrow evening, at which I expect they'll update their numbers) December 15th. California will likely add at least another 100,000+ all by itself by the time January 31st rolls around, so that shortfall doesn't tell us much.
At this point, at least 13 14 states have surpassed last year's total (Minnesota is dead even but still has 2 weeks of data missing), and both Colorado and Massachusetts will likely break 2017's numbers as well. I expect New York and California to come within 3%, and Vermont to come within 5%.
Aside from the overall numbers coming unexpectedly close to last year in general, the states which stick out to me at the top and bottom of the spectrum are:
Kentucky: 10% ahead of last year. This is likely a one-time correction due to being moved from their own exchange (kynect) to the federal exchange (HealthCare.Gov) last year, when they dropped by over 13% from the year before...all current enrollees in Kentucky had to start from scratch with new accounts/applications as opposed to simply being auto-renewed or just picking a different plan from their existing account. They didn't have to do that again this year, which presumably helped bump KY's numbers back up this year.
UPDATE: I just spoke with John Watkins, the Acting Executive Director of the Kentucky Health Benefit Exchange, who gave me an overview of what he believes actually happened in Kentucky this year. This ties in with a different post I was planning on writing up anyway, which I'll link to as soon as it's posted. The short version: He doesn't believe that my "correction from the move" theory really played any role at all in their success this year.
Louisiana: Louisiana was among the many states which Silver Loaded CSR costs, which should have helped with enrollment; even if it didn't, most of the other states which utilized Silver Loading came much closer to last year's total. They only have 2 carriers on the exchange, but the same is true of many other states; their unsubsidized premium increases are steep (21%) but actually somewhat lower than the national average (30%).
LA expanded Medicaid halfway through 2016, which did have a huge impact last year (enrollment plummeted by a solid 33% from 2016 to 2017 as a result). I had been assuming that this wouldn't still be a factor by now...but the additional 24.5% drop gives me pause.
This year Louisiana enrollment is down another 33,722 people. LA's Medicaid expansion enrollment is up to 457,178 as of yesterday, which is over 83,000 people higher than December 2016. Assuming it would "normally" be down around 5% (7,200), Medicaid expansion effect could account for the "additional" 26,500 shift, although this is speculative. Assuming that's not the cause...I'm stumped.
Advertisement
