

Milliman provides one of my Holy Grails: Hard OFF-EXCHANGE enrollment data!
Fri, 04/07/2017 - 3:08pm
Ever since I started this venture, one of the most difficult types of data for me to hunt down have been the ever-elusive off-exchange individual market enrollment numbers.
Off exchange data is extremely difficult to come by for several reasons. First, because unlike enrollments via the ACA exchanges, off-exchange enrollment data is a purely private transaction between individuals and private corporation. Yes, publicly traded companies have to provide some level of data in their quarterly & annual reports, but that data usually focuses on the financial side. Yes, they generally do give some info about how many enrollees they have, but they don't always break out the individual market specifically...and when they do, they often don't distinguish between the on and off-exchange numbers. Finally, even when they do break it out into that much detail, you'll be hard pressed to find a carrier who breaks the numbers out by state (unless they only operate in one or two states to begin with).
Even if every carrier did provide a full breakout...well, there's something like 300 of them nationally; it would take gobs of time for me to pour over 300+ financial reports and pulling together every enrollment data point for each carrier in each state. Believe me, I've tried.
Oh, yeah, one more thing: Even then, there's three different categories of off-exchange enrollees: ACA compliant, Grandfathered and (in some states) Transitional plan enrollment. Sheesh!!
As a result of this, I've had to cobble together extremely rough estimates from a variety of sources based on a mish-mash of hard data, estimates and extrapolation. In general, I operated on the assumption that the total individual market was roughly 50/50 on exchange/off-exchange in 2014, but had shifted to roughly a 60/40 split as of 2016. I was vindicated on this estimate about a year ago, when Steve Davis and Robert Laszewski took a crack at it. At the time, my estimate was that the national breakout was something very close to:
- On Exchange (subsidized): 9.4 million
- On Exchange (unsubsidized): 1.7 million
- Off Exchange (ACA compliant): 7.1 million
- Off Exchange (Grandfathered): 1.5 million
- Off Exchange (Transitional): 500,000
...for a grand total of around 20.2 million, of which around 18.2 million were part of the ACA-compliant risk pool. It's important to note that the 760,000 BHP enrollees in Minnesota & New York are not included in any of these totals.
This year, the exchange-based market (not including BHPs) dropped by around 465,000 people year over year, partly due to cannibalization by the BHP program in New York; partly due to cannibalization by Medicaid expansion in Louisiana; and partly due to, well, deliberate sabotage on the part of the Trump administration via FUD and killing off the final-week Open Enrollment Period ad campaign.
As I noted a few days ago, according to analytical firm Mark Farrah Associates, the total individual market appears to have shrunk from that 20.2 million all-time high just over a year ago down to around 18.8 million as of last September. We know that the on-exchange portion of this dropped by nearly half a million people (probably more like 400K when you take non-payments and attrition into account), so assuming the off-exchange market stayed exactly the same, that should bring the total indy market down to around 18.4 million as of April 2017.
Except, of course, that the off-exchange market hasn't stayed static either. Some of those enrolled in grandfathered and/or transitional plans have either died, turned 65 (and thus moved onto Medicare), fallen on hard times (and thus moved onto Medicaid) and so on. Others, of course, were scared off by the 25% average unsubsidized individual market premium hikes we saw this year, and either got a job with benefits, transitioned to a "healthcare ministry" plan or dropped coverage entirely (perhaps relying on a short-term or "mini-med" plan) and paid the individual mandate penalty instead.
Well, earlier today Paul Houchens of Milliman (one of the largest/most respected actuarial firms in the world) gave me a heads up regarding a state-by-state, comprehensive ACA subsidy study which they've published. This report mainly focuses on the financial side of the ACA for obvious reasons (how many have been/are currently receiving APTC and/or CSR assistance, etc), but it also provides some excellent hard enrollment numbers for 2015, 2016 and 2017.
Given the focus of the report, most of the data focuses on on-exchange enrollees...but (and this is key), they also provide estimates of the total individual market size for every state. By subtracting the on-exchange number from the total, I get their best guess as to the total off-exchange numbers for every state. Here's what it looked like in 2015, for instance:
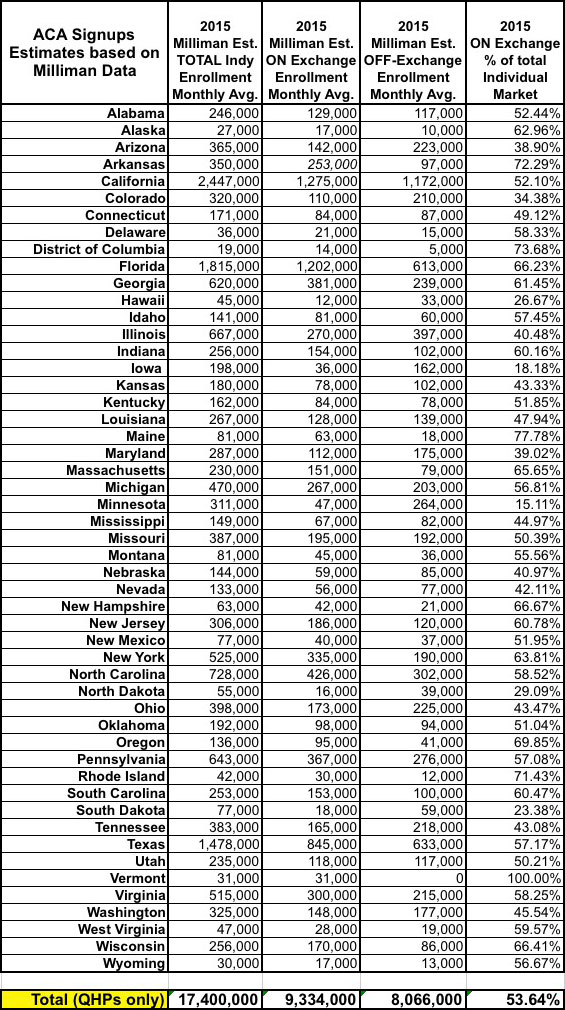
Now, there are a couple of important caveats, as always:
- All of their estimates refer to the average monthly enrollments over the course of the full year. Since around 10% of enrollees never pay their first premium at all, and there's some amount of attrition over the course of the year, Milliman estimates that the full-year monthly averages are only about 80% as high as the initial plan selection totals.
For instance, for 2015, 11,688,074 people selected QHPs via the ACA exchanges as of the end of open enrollment, but Milliman estimates that the monthly average enrollment was only around 9.33 million, or 79.9% of that.
For 2016, they estimate the monthly enrollment average as 10,098,000 out of the 12,681,874 who selected exchange plans, or about 79.6%.
For 2017, they're currently projecting the monthly average to be 9,794,000 out of the 12,216,003 who selected exchange plans, or about 80.2%.
In all three cases, the First Quarter numbers (that is, as of the end of March of each year) are likely somewhat higher; the effectuated enrollment numbers in both 2015 and 2016 as of 3/31 was around 87% of the QHP selection total. It's safe to assume this is about where things stood as of 3/31/17 as well. Therefore, to get an accurate Q1 2017 snapshot, I have to bump Milliman's 2017 estimates up by about 8.8%, to roughly 10.6 million on-exchange enrollees.
- The second major caveat is that while Milliman has hard off-exchange estimates for 2015, they don't have any such estimates available at the state level for 2016 or 2017. However, Houchens was able to provide me with a rough guess at the national level:
@charles_gaba i would estimate total 2016 enrollment will be around the 17.5 million reported for 2015
— Paul Houchens (@PaulHouchens) April 7, 2017
He confirmed that 17.5 million refers to the monthly average for the total market in both 2015 and 2016, vs. the 18.8 million Q3 2016 snapshot estimate from Mark Farrah.
He also gave a rough estimate of perhaps 90% of the total individual market now being ACA-compliant, leaving around 10% of it still enrolled in grandfathered and/or transitional policies:
@charles_gaba The 2015 MLR data had 76% of individual market membership as risk corridor eligible,with churn we are probably approaching 90% ACA-compliant
— Paul Houchens (@PaulHouchens) April 7, 2017
Nationally, Milliman estimates that the on-exchange market made up roughly 54% of the total in 2015 and about 59% of it in 2016. Much of that ratio increase was due to several states (Colorado, Illinois and Oregon) dropping "transitional" plans at the end of 2015; no additional states dropped these at the end of 2016 (although all of them were supposed to drop them at the end of 2017...except that this deadline has been extended again, this time by Tom Price's HHS Dept.)
For the Spring 2017 Snapshot, then, I'm assuming that:
- The on-exchange market makes up just over 60% of the total this year, including grandfathered/transitional plans;
- Grandfathered/Transitional plans make up around 12% of the total in states which still allow Transitionals; and
- Grandfathered plans make up around 5% of the total in states which don't allow Transitionals (the exception to this is Iowa, where I know a whopping 100,000 people, or over 50% of the entire individual market, is still enrolled in either Grandfathered or Transitional plans...which is a big part of the reason Iowa is having serious risk pool problems in the exchange market).
Using these assumptions, here's what I've come up with as my best estimates of the current breakout across every state:
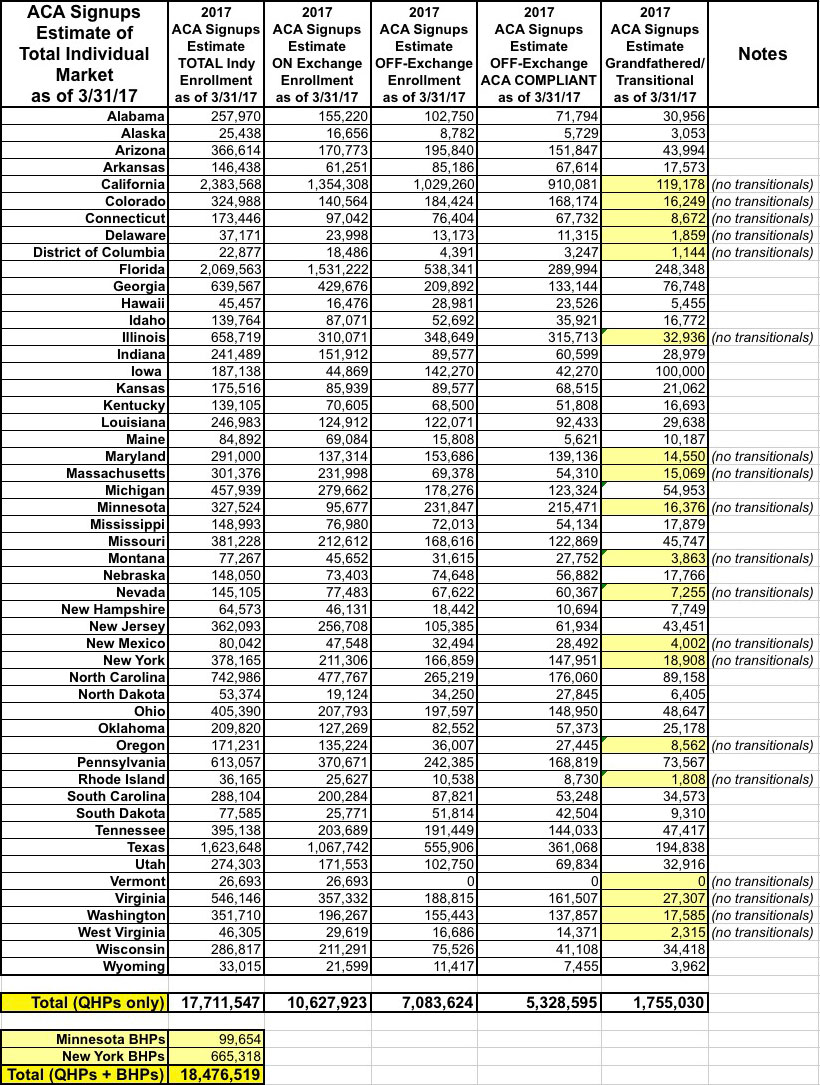
As you can see, not only is the grand total about 2.5 million smaller than I had it pegged a little over a year ago (1.7 million when you include BHPs), the breakout is different as well:
- On Exchange (subsidized): 9.0 million (51%)
- On Exchange (unsubsidized): 1.6 million (9%)
- Off Exchange (ACA compliant): 5.3 million (30%)
- Off Exchange (Grandfathered/Transitional): 1.8 million (10%)
(I should note that there's really not much point in distinguishing between "grandfathered" and "transitional" anymore; the latter category have now been bumped out by 5 full years, and I'm pretty sure both parties will continue to kick that can down the road indefinitely, so they might as well be "grandfathered" at this point).
Again, I could be off a bit on any number of these, but this should be fairly close to the situation. If so, this means that the monthly average annual individiaul market progress has been something like:
- 2013: 10.6 million
- 2014: 15.6 million
- 2015: 17.5 million
- 2016: 17.5 million
- 2017: 16.7 million (projection)
...with roughly 400K being "lost" to BHPs/Medicaid/etc on the exchange and another 400K or so being lost off-exchange due to people dropping out of the official individual market altogether.
That's around a 4.6% drop, perhaps 40% of which is due to either BHP or Medicaid cannibalism. Call it perhaps 2.8% dropping for reasons related to rate hikes/narrow networks and/or other legitimate problems with ACA-compliant policies.
Does that count as a "death spiral"? It doesn't sound like it to me, but I honestly don't know.
Oh, if you really want to see the full spreadsheet with the 2015, 2016 and 2017 monthly average estimates as well, here you go...it's a bit of a beast, though (click the image for the full-size version):

Advertisement
