

Huh. Imagine that.
Thu, 03/16/2017 - 10:37am
Of course, it's impossible to prove that the Trump executive-order/ad-kill combo was the cause of the numbers petering out at the end of the enrollment period...but I have some pretty strong evidence that it did.
How? Well, remember, the 12 state-based exchanges, which cover around 1/4 of all Qualified Health Plan (QHP) selections nationally, were not hurt by the ads being killed. The executive order might have had some impact, but the actual HC.gov ads being yanked shouldn't have hurt them much since these exchanges have their own, separate branding, marketing budgets and outreach programs.
I therefore decided to compare how the 39 HC.gov states performed relative to the 12 state exchanges...the results are pretty telling.
...UPDATE 3/16/17: I've updated the tables and chart below with the final, official 2017 Open Enrollment Period numbers from CMS.
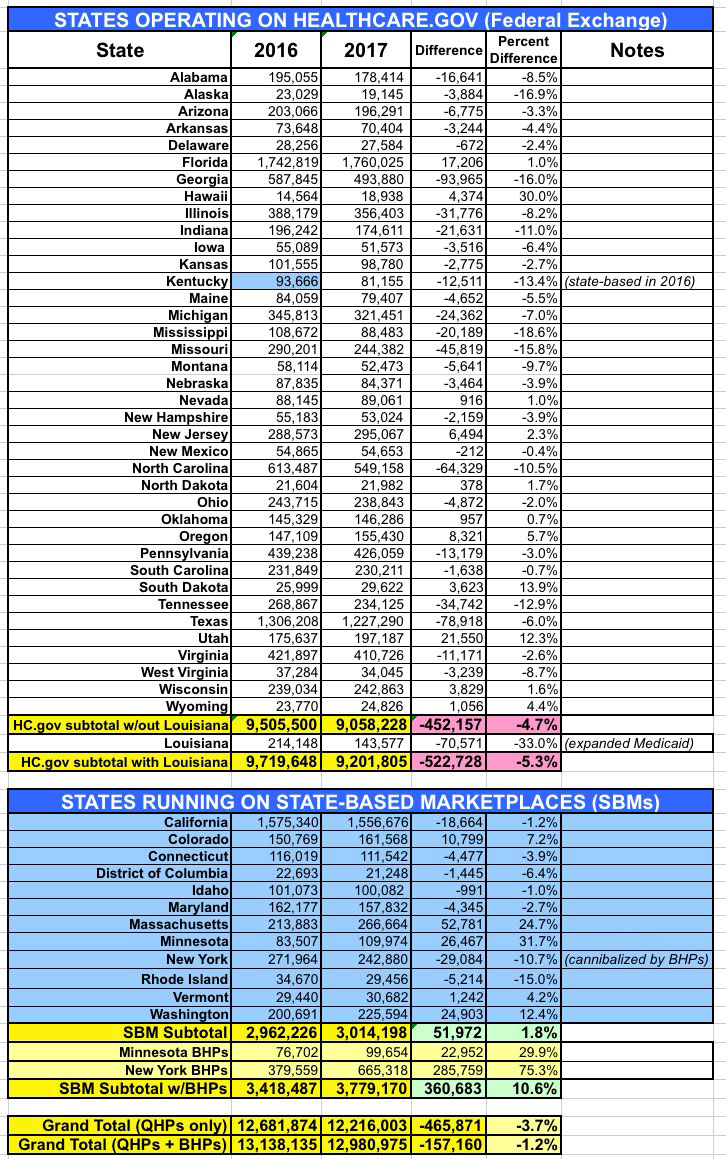
Once again: The 39 states which operate off of the federal exhange (HealthCare.Gov), which is where the last-minute ads were pulled, saw a drop in enrollment of either 4.7% or 5.3% year over year, depending on whether you include Louisiana or not (special case, since they also expanded Medicaid in the middle of 2016, which cannibalized many exchange enrollees anyway).
Meanwhile, the 12 states which ran their own exchange advertising/outreach efforts and which didn't kill ads/marketing in the final 5 days saw an overall increase in enrollment of 1.8% if you don't include the BHP program in NY/MN, or 10.6% if you do.
The Volume Of TV Advertisements During The ACA’s First Enrollment Period Was Associated With Increased Insurance Coverage
The launch of the Affordable Care Act was accompanied by major insurance information campaigns by government, nonprofit, political, news media, and private-sector organizations, but it is not clear to what extent these efforts were associated with insurance gains. Using county-level data from the Census Bureau’s American Community Survey and broadcast television airings data from the Wesleyan Media Project, we examined the relationship between insurance advertisements and county-level health insurance changes between 2013 and 2014, adjusting for other media and county- and state-level characteristics. We found that counties exposed to higher volumes of local insurance advertisements during the first open enrollment period experienced larger reductions in their uninsurance rates than other counties. State-sponsored advertisements had the strongest relationship with declines in uninsurance, and this relationship was driven by increases in Medicaid enrollment. These results support the importance of strategic investment in advertising to increase uptake of health insurance but suggest that not all types of advertisements will have the same effect on the public.
...Our results show strong and stable associations between the volume of insurance advertising and health insurance gains in counties between 2013 and 2014. Specifically, for every 1,000 advertisements shown, we observed an average decline in uninsurance of 0.1 percentage point. Most of these gains in insurance appeared to be driven by the variations in volume of advertisements sponsored by state Marketplaces. In models examining differences in Medicaid enrollment between 2013 and 2014, we found that state-based Marketplace advertisements were associated with larger gains in enrollment, even when we examined only within-state differences in advertisement volume. To put these estimates in context, we estimated that 593,251 insurance advertisements were aired in our sample counties during the first open enrollment period. Of these, 148,120 were state-sponsored advertisements. Moving from the twenty-fifth to the seventy-fifth percentile of state advertisements aired in a DMA would be an increase of about 800 such advertisements. Our models suggest that for that amount of outreach, 2,077 people in a DMA would gain insurance (a decrease in the uninsurance rate from 12.71 percent to 12.56 percent), representing approximately 2.5 people per state-sponsored advertisement. Our models also predicted that doubling state-sponsored advertisements from the mean of 800 at the DMA would reduce the uninsurance rate from 12.56 percent to 12.41 percent (a 1.19 percent reduction). These main findings, combined with sensitivity analyses providing additional support for an underlying causal relationship between media volume and enrollment, suggest that the efforts of those involved in marketing health insurance options—and state governments in particular—might have contributed to the uptake in health insurance. Interestingly, we saw no evidence that advertisements sponsored by private sponsors (health insurance companies themselves) were associated with insurance gains, despite the fact that private companies were the most prominent advertisement sponsor.
These results have implications beyond the initial implementation period of the ACA. The future of the ACA is uncertain as of spring 2017, and proposals by Congress to repeal and replace the ACA are under discussion. Any health insurance system—particularly a system with a strong private-sector role, as articulated in Republican plans—will rely on marketing to attract new consumers. Indeed, this study demonstrates an important finding for health communication and health policy more generally: Consumers are responsive to persuasive health communication messages about health insurance, but the type of advertisement might matter.
Advertisement
