

Pennsylvania: ACA Medicaid expansion breaks 625K in first year
Mon, 05/02/2016 - 10:38am
Hat Tip To:
Andrew Sprung
I was fascinated when I saw this phenomenon happen here in Michigan last year, but it's repeated itself in several other states since then. State and federal officials crunched their demographic data and came up with estimates of the maximum number of residents who they expected to be eligible for the ACA's Medicaid expansion provision a couple of years back, along with the number of those expected to enroll in the program in the first year. They're then caught offguard when not only does the actual number eligible turn out to be far higher than they expected, but far more of those eligible go ahead and sign up in the first year than expected.
In Michigan, estimates ranged from 477K - 500K being eligible; instead, the number broke 600,000 the first year, where it's hovered around ever since (as of last week it stood at 615,536).
Pennsylvania, meanwhile, got off to a late start in large part due to an ill-conceived "alternate" Medicaid expansion plan briefly implemented by GOP Governor Tom Corbett which was, thankfully, scrapped and completely replaced with "standard" Medicaid expansion by new Dem Governor Tom Wolf. Officials expected that up to 600K would be eligible, and as of last summer 439,000 had already signed up. By December it was up to 500K.
Well, one year after standard expansion went live, the state of Pennsylvania is reporting that:
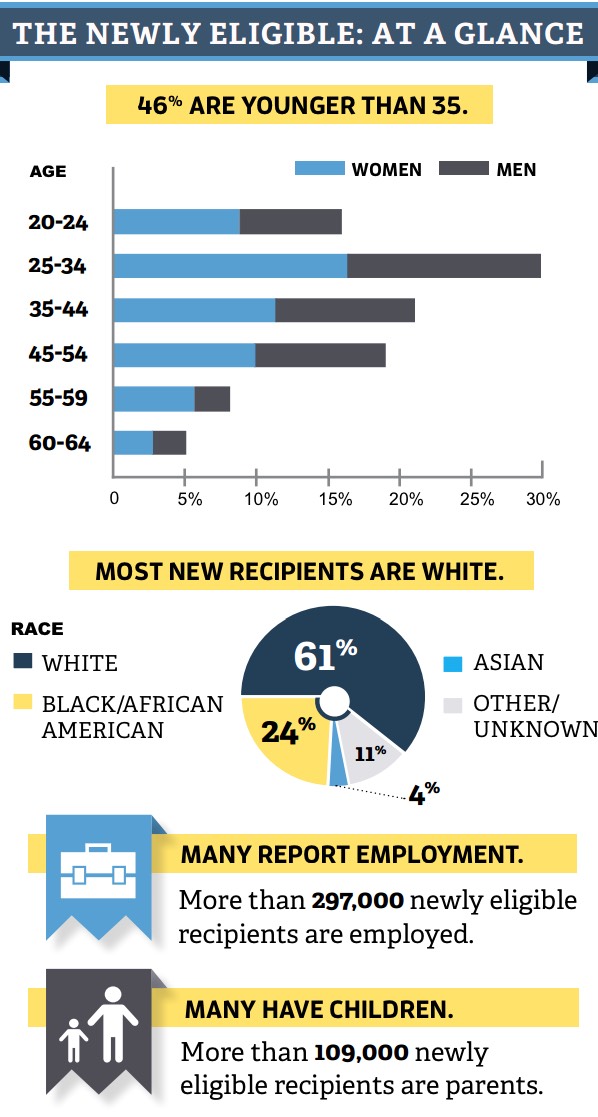
As of April 2016, the expansion had reached 625,970 newly eligible Pennsylvanians, ages 18 to 64.
Yup, that's 26,000 more people enrolled than anyone had even thought were eligible for the program.
UPDATE: It's been pointed out to me that a number of potential "woodworkers" (people who were already eligible for standard Medicaid) may have been nudged over to ACA expansion Medicaid instead depending on their circumstances, since ACA expansion covers 100% of enrollee costs (or as low as 90% in another few years), whereas standard Medicaid is only about 60% covered by federal dollars. This could easily account for some of the discrepancy.
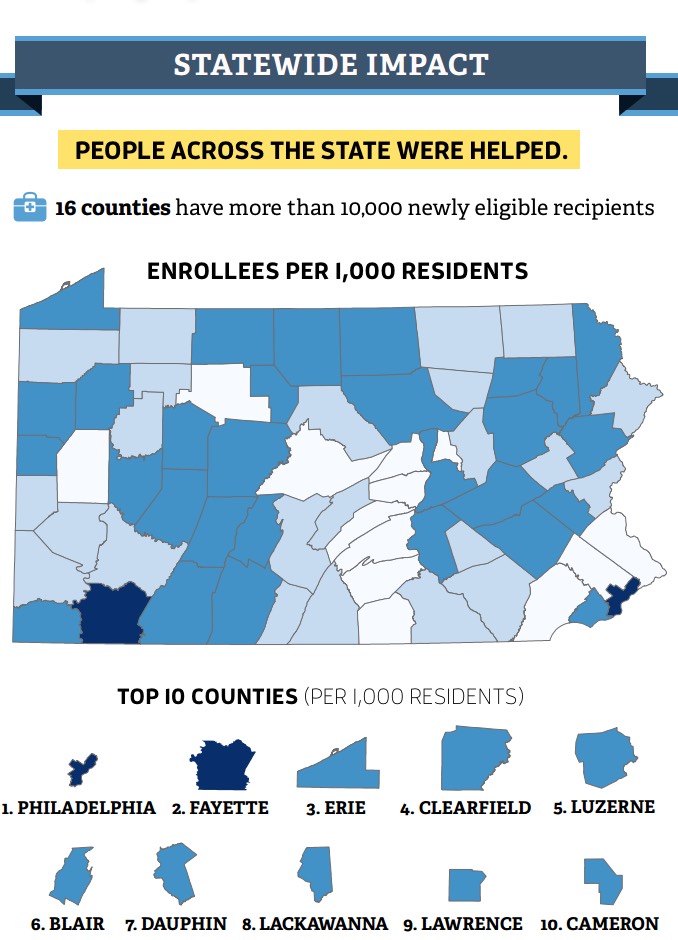
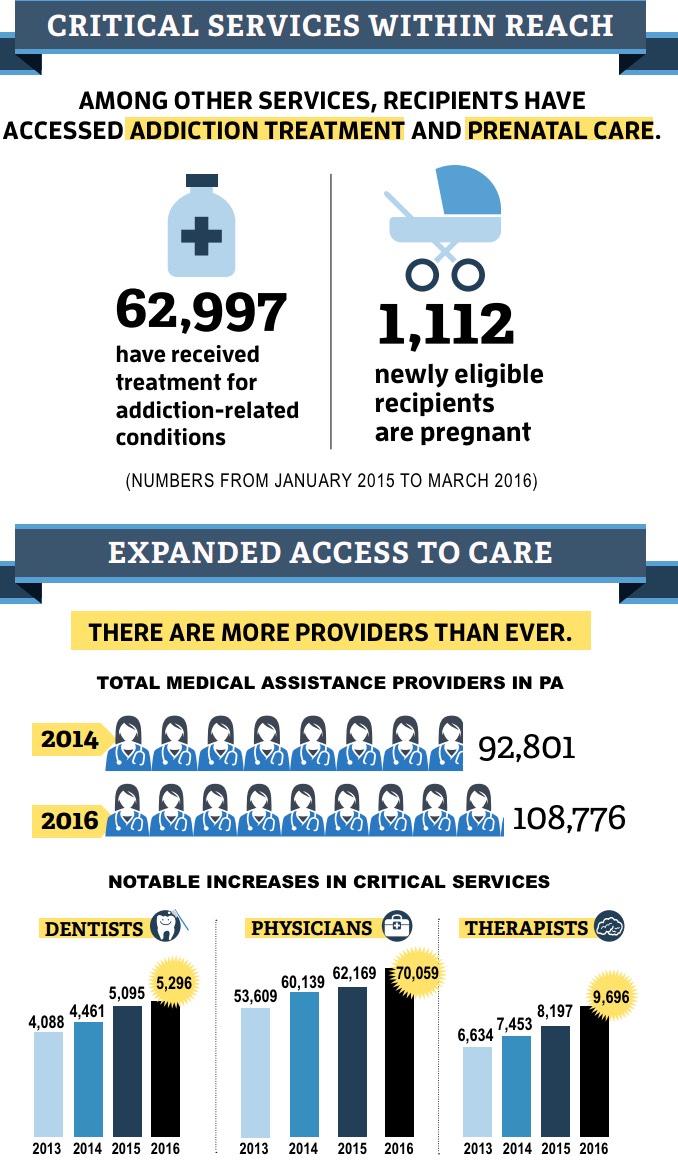
They're presenting this as part of a nifty InfoGraphic with all sorts of demographic breakdown stuff:
Advertisement
