

UPDATED: Gallup-HealthWays Well-Being Survey confirms my expectations & then some!
Thu, 04/07/2016 - 9:50am
I know I haven't posted much of anything for the past week or so. I'm playing catch-up with my day job and my kid is on spring break this week, so I haven't had much time to devote to the site. Furthermore, we're spending today at the Michigan Science Center, so I can't really do a proper post today either.
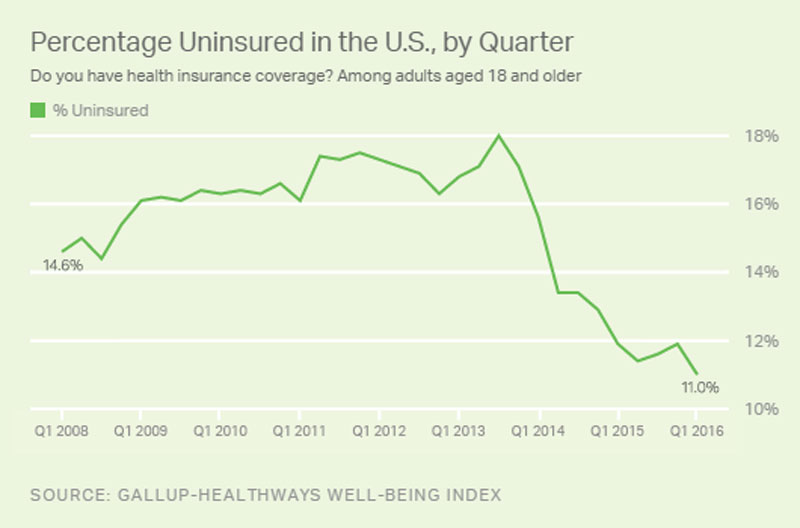
HOWEVER, Gallup just released their latest quarterly Gallup-Healthways Well-Being Index Survey, and the results are better than what I expected them to be:
As I said back in January, when the Q4 2015 survey was published:
Assuming ESI coverage has remained fairly stable over the year, and with Medicaid expansion tapering off while Medicare continues to quietly grow at it's normal pace, I'm pretty certain that the rate will level off again or (hopefully) drop back down several tenths of a percentage point in the Q1 2016 survey as exchange enrollment ramps back up again.
In fact, the rate has dropped more than that: 9/10ths of a percentage point, down to an even 11.0%.
I'll have much more to say about this tonight, but there are two key points here. First, as Gallup says:
In the first quarter of 2016, the uninsured rate among all U.S. adults was 11.0%, down from 11.9% in the fourth quarter of 2015. This marks a record low since Gallup and Healthways began tracking the uninsured rate in 2008. The uninsured rate has declined 6.1 percentage points since the fourth quarter of 2013, which was right before the individual mandate provision of the Affordable Care Act took effect in early 2014 that required Americans to carry health insurance.
And secondly, the Gallup-Healthways survey DOESN'T INCLUDE CHILDREN, which is why the actual uninsured rate across the entire U.S. population is even lower than this.
More to come tonight...
UPDATE 11:00pm: OK, as promised, here's the rest of this post...
As I've noted every quarter for the past year, it's important to note that the version of the chart that Gallup always displays (see above) doesn't include the full Y-axis...that is, it only goes down to 10%, so the change appears far more dramatic than it actually is.
As I do every quarter, I've ported the Gallup data over into my own version of the chart which includes the full Y-axis. In addition, I've thrown in rough estimates of the three chunks of the uninsured population which the Affordable Care Act, as it currently stands, can not get covered (at least without the assistance of the Republicans in Congress and/or the Governors/state legislators of 19 GOP-controlled states): Undocumented immigrants (around 4.7 million); those caught in the "Medicaid Gap" (around 2.8 million) and adults who are already eligible for traditional Medicaid, yet haven't actually taken it upon themselves to enroll, either due to not being aware that they're eligible, not knowing how to do so or feeling a stigma about being on public assistance (around 5.0 million):
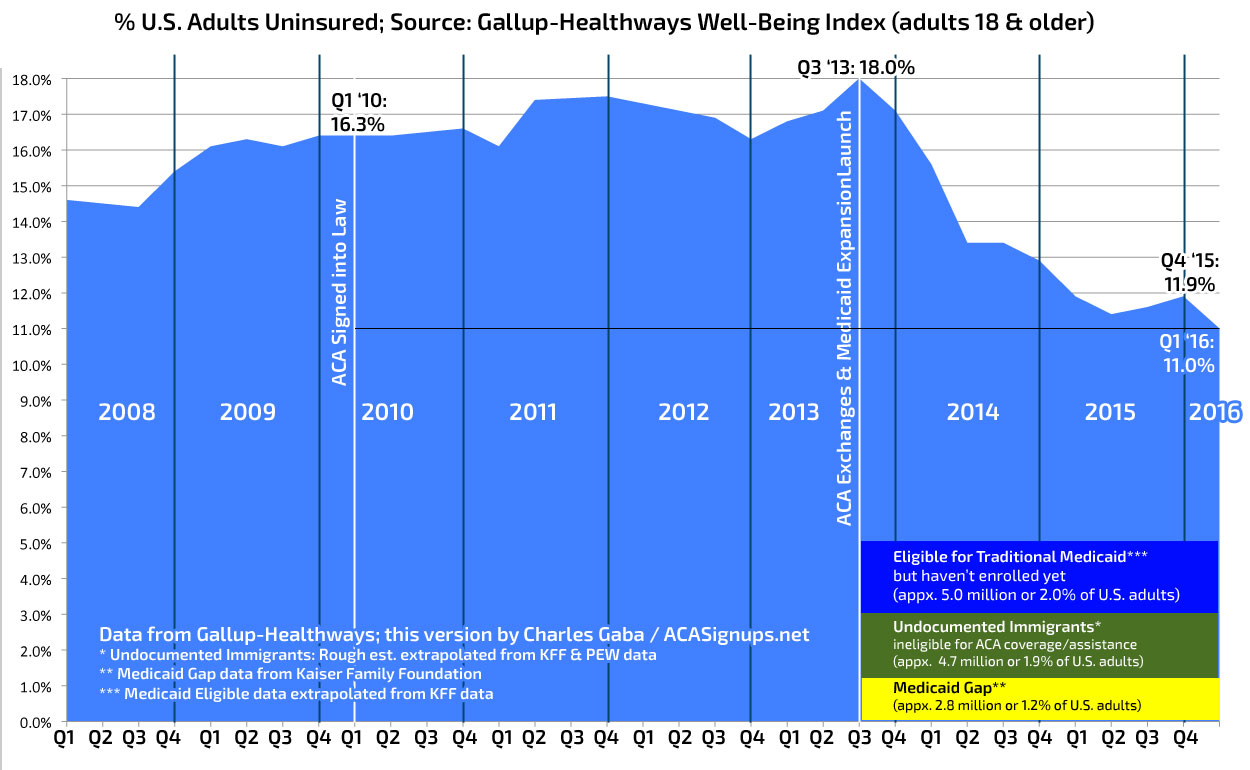
As you can see, while showing the full picture does take away some of the impact of the drop since the launch of the ACA exchanges in Q3 2013, it's still pretty impressive...and separating out the Undocumented/Medicaid Gap portions make this a more reasonable measure anyway. It's hardly fair to "blame" the ACA for not covering these people when it was never designed to cover some of them and a chunk of the law was disabled for the other two years after it passed.
As noted earlier, there's another important piece of data missing here: Children under 18. This is no small thing; children make up appx. 23.1% of the total U.S. population, or appx. 74.6 million. According to the latest National Health Interview Survey, there were 4.8 million uninsured kids in 2013 (about 6.5% out of 73.6 million), and this had dropped down to just 3.3 million (4.5%) as of September 2015.
Since the Gallup survey only includes adults over 18 (about 248.4 million people out of 323 million total), that makes the actual national uninsured rate more like:
11% x 248.4 million = 27.3 million, plus 3.3 million children = 30.6 million, give or take...or just 9.5% of the total population.
As noted in my recent attempt to chart the health coverage of the entire U.S. population, these numbers jump around a bit depending on the source and methodology. For instance, the NHIS had the total uninsured rate down to just 9.1% last fall, and doesn't include any of the 2016 Open Enrollment data, and both their 9.1% (total) and 4.5% (for kids) figure refers specifically to "uninsured at time of interview". Other surveys may ask the question diferently, have different margins of error and so forth. This is why I went with a mid-range of 29.0 million for my big pie chart vs. the 27 million low end or 32 million high end estimates which have been tossed around.
In any event, I expect Gallup's Q2 survey to show only a slight further dip before leveling out or even swinging back up slightly in the 3rd and 4th quarters, just as it did last year...but the overall trend is still downwards, if not nearly as dramatically as it was in 2014. Two steps forward, one back...
Advertisement
