

UPDATE: While we're waiting, here's where things stand and how much is missing...
Mon, 02/01/2016 - 1:07pm
UPDATE 2/04/16: OK, I've confirmed that Covered California will be releasing their numbers at around 1pm 4pm this afternoon (whoops...forgot about the time zone difference), while HHS will be holding a call at around 3pm to discuss the Open Enrollment period in general at around 3pm. I don't know if they'll give out just the HealthCare.Gov numbers (38 states) or the national total today, but even if it's HC.gov only, with CoveredCA and the 5 states which have already released their numbers (see below), that'll still be 44 states accounted for representing over 90% of the national total (plus most of the enrollment in the remaining 6 states +DC is already booked as well). Still, I'm pretty sure they'll give the grand total regardless. Stay tuned...
According to Dan Diamond of Politico, the total number won't be released by HHS until Thursday or Friday.
The lack of at least a general "over X million signed up!" announcement yesterday or today could be chalked up to all eyes being focused on the Iowa Caucus, but waiting until Thursday/Friday is...unexpected, to say the least. The main possibilities I can think of:
- The grand total could be very close to the 12.5 million or 13 million mark, and they're hoping that stragglers from California/Maryland/DC/etc. will nudge it over the top.
- There might have been some major clerical/reporting snafu/holdup (100K+?) which they're scrambling to straighten out before announcing.
- Maybe I've single-handedly convinced them to break the report out to distinguish between gross QHP selections and net (cancelled) selections for each individual state, and they're taking an extra day or two to write up a more detailed report :)
As of this writing, the confirmed total stands at exactly 11,874,548 QHP selections, which is about 186,000 more than last year's 11,688,074 tally. Of course, you also have to tack on at least 300,000 more purged/cancelled enrollees for a fair apples-to-apples comparison.
In the meantime, here's where all of the states stand in terms of missing days of data:
- All 38 HealthCare.Gov States: 8 days missing - Final Week 13 Snapshot Report to be released sometime Thursday or Friday afternoon?
- California: 4 days missing (plus 6 days of 'overtime' enrollees) - Note: Enrollment numbers to be announced Thursday at around 1:00pm
- Colorado: COMPLETE (153,583) (plus 29 days of SEP enrollees)
- Connecticut: 12 days missing
- District of Columbia: 36 days missing (plus 2 days of 'overtime' enrollees)
- Idaho: 8 days missing (I've been informed that the official number won't be released until 2/15, but it will be the effectuated number)
- Kentucky: 36 days missing
- Maryland: COMPLETE (165,123) (plus 4 days of 'overtime' enrollees)
- Massachusetts: 31 days missing
- Minnesota: COMPLETE (85,390)
- New York: 7 days missing
- Rhode Island: COMPLETE (34,670)
- Vermont: 36 days missing
- Washington State: COMPLETE (200,000)
For comparison, last year, HealthCare.Gov added roughly 1.048 million QHPs in the final week, plus 242K more on top of that during the "overtime" period, for a total of 1.29 million in the last leg (although they actually also "pre-purged" 200K cancelled accounts...except that number ended up only being around 90K after all, so it got kind of messy). That means that HC.gov increased their final tally by 13.5% in the final official week, and an additional 3.1% in the "overtime" period.
Put another way, HC.gov enrolled an average of 91,153 people per day for the first 12 weeks, and 131,000 per day in Week 13 (or 86,000 per day if you include the overtime period). That's around 44% higher than the average for the rest of the enrollment period (or 6% less with the overtime week).
This year, HC.gov enrolled 8,939,274 in the first 12 weeks, or 106,420 per day on average. A 44% increase on that would be roughly 153K per day, or 1.22 million more added to the total in Week 13, bringing the HC.gov total to around 10.16 million. If you add that to the 11.84 million confirmed QHPs so far, that would bring the total up to just over 13 million, plus perhaps 200K more from the state exchanges. However, again, I'm just throwing numbers around; at this point, it makes more sense to just wait and see what the final numbers actually are.
UPDATE: Hmmm...OK, I've been informed that HC.gov traffic was at around 80,000 concurrent users as of around 11pm. I'm assuming it peaked earlier the evening, at perhaps 100,000 or so.
For comparison, on December 14th, traffic peaked at around 185,000 at around 9pm. CMS also confirmed that HC.gov had around 500,000 QHP selections on 12/14.
Assuming a straight correlation, this suggests perhaps 270,000 QHPs yesterday via HC.gov, which would in turn suggest perhaps 360,000 nationally. It would also suggest around 280,000 nationally on Saturday and perhaps 200K collectively for the previous 5 days. Throw in another hundred thousand or so to cover the missing days above prior to 1/23 and you're in the 800K - 900K range...which, again, brings things up to around 12.8-12.9 million total.
...but again, we won't know until they give out the actual numbers.
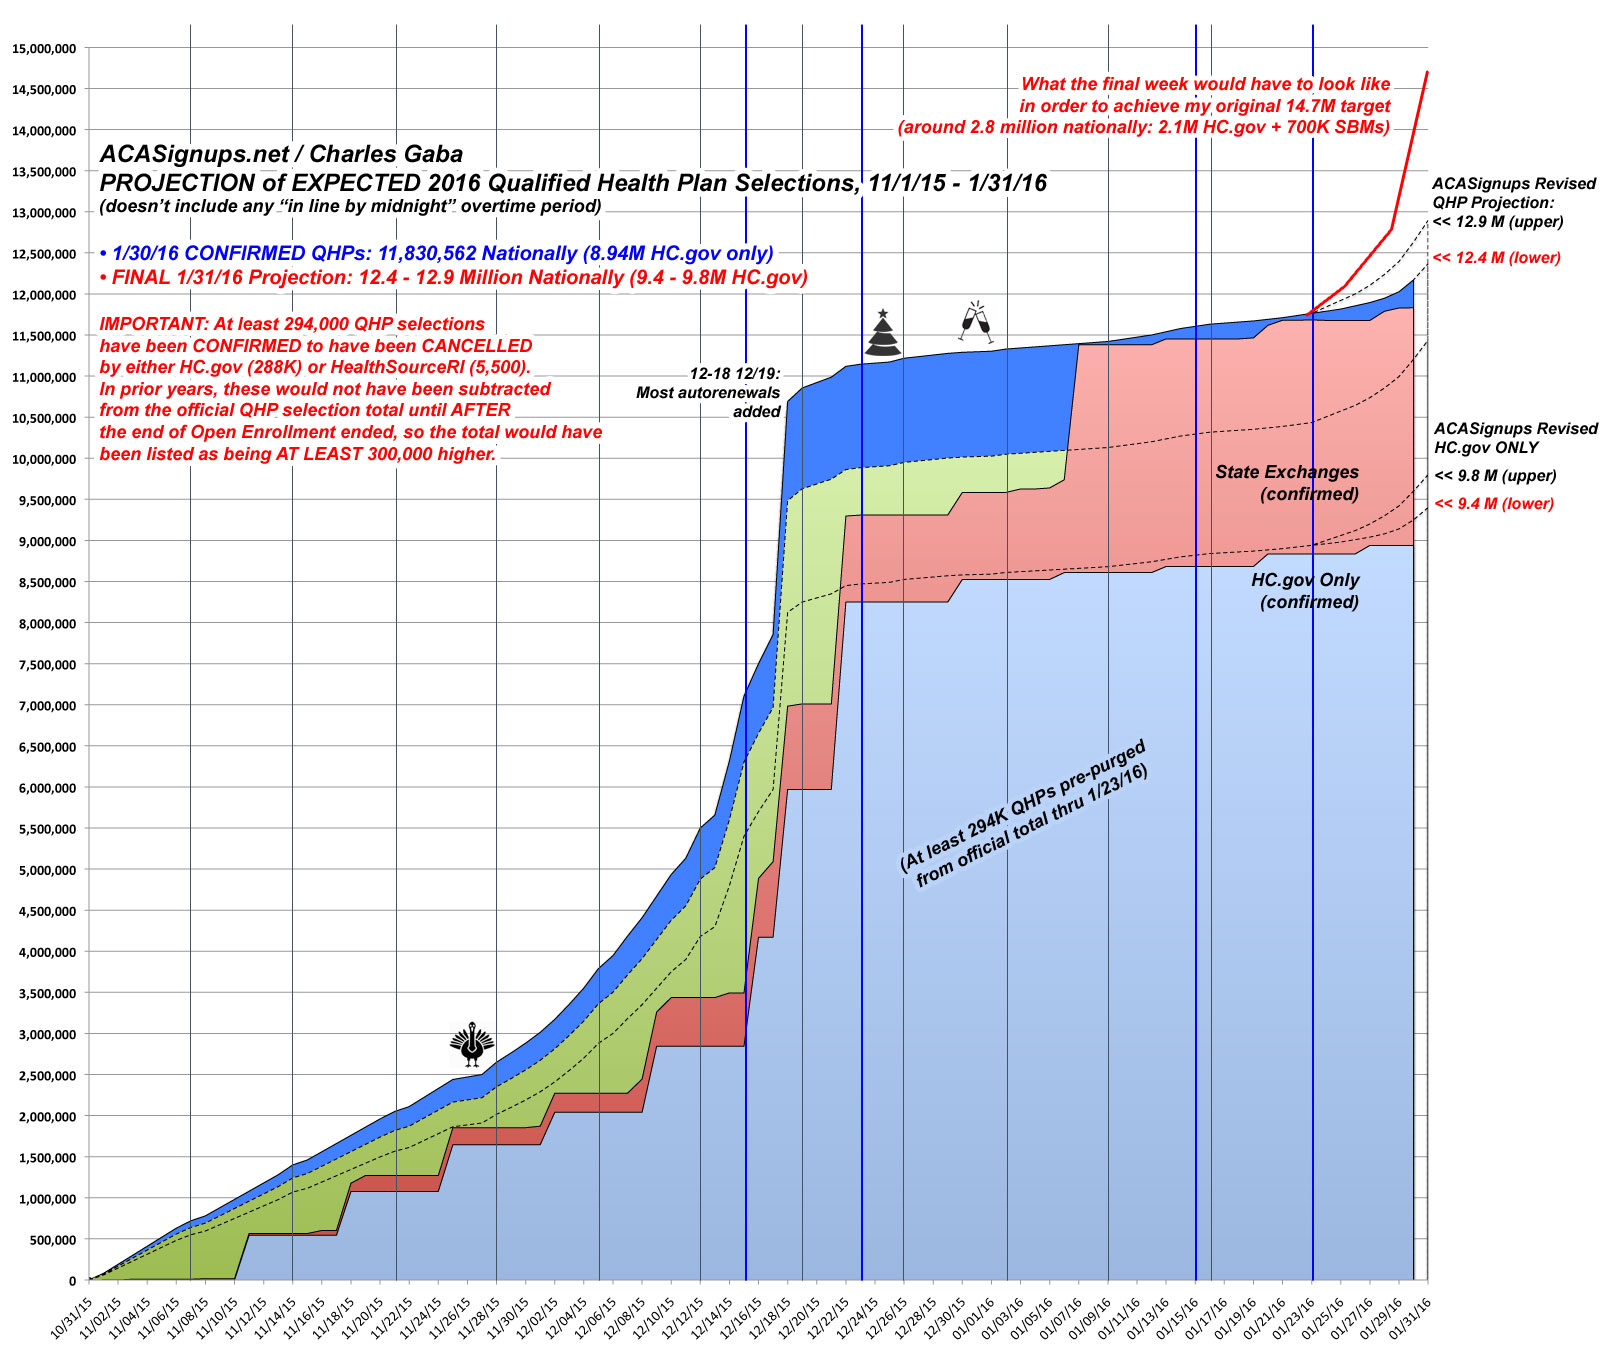
Just for the heck of it, this is what The Graph would have to look like in order for the final tally to end up hitting my original target of 14.7 million after all; needless to say, that's pretty unlikely at this point:
Advertisement
