

Kaiser Family Foundation releases a mountain of 2015 ACA data.
Thu, 05/21/2015 - 11:35am
Holy smokes. The Kaiser Family Foundation, without which running this site would be much harder, has released their 2nd annual (I assume it'll be done every year) Survey of Non-Group Health Insurance Enrollees.
There's a heck of a lot of findings to absorb here, almost all of which overlaps with the areas I cover here at ACASignups.net, so it'll take some time to go over it all. However, here's my initial thoughts:
The survey, conducted February 18 – April 5, 2015, after the close of the second open enrollment period, includes individuals who purchased ACA-compliant coverage inside or outside of a Marketplace, as well as those who are currently enrolled in “non-ACA compliant” plans.
These are really important points to keep in mind when looking at their findings. It does include off-exchange enrollments, whether ACA-compliant or not (and in fact those distinctions are the focus of some of KFF's findings).
On the other hand, while it includes the 11.4 million people who enrolled via the exchanges during the official Open Enrollment Period, it only partially includes the additional 300,000 who enrolled during the "overtime" period from 2/16 - 2/22 (that is, they started interviewing people while the extension period was still running, although the vast majority of the survey period took place after that was over). In addition, the KFF survey also only partially included the 200,000 people who enrolled during the Tax Filing Season special enrollment period, which ran from 3/15 - 4/30. Finally, the resutls are likely skewed a bit by the normal churn of people enrolling and/or dropping their policies during the off-season due to Life Changes (getting married/divorced, giving birth/adopting, moving to a new state, getting out of jail, losing existing coverage/getting a job with coverage and so forth).
OK, with all of that out of the way, here's what they've come up with:
- My estimate of total OFF-exchange policies looks about right, but my ratio between ACA-compliant & non-compliant enrollments may be off.
Last year, the ACA-compliant individual market was split roughly 50/50 between exchange enrollees and off-exchange enrollees (around 7 million via the exchanges and 7 million ACA-compliant policies off the exchanges), plus another 5 million or so non-compliant policies.
This year, I've repeatedly estimated that the total market has grown to around 22 million or so, broken out (as of mid-May) to around 12 million exchange-based, 8.5 million off-exchange, and perhaps 2 million non-compliant policies ("grandfathered" or "transitional"). Of course, then you have to lop off around 10-12% of the first two numbers for non-payment (whereas those in non-compliant policies have, by definition, been paying continuously for several years, and therefore should be hitting a near 100% payment rate).
That would drop the numbers down to around 10.9 million, 7.6 million and 2 million. Percentage-wise, that would be 53%, 37% and 10% respectively.
Kaiser's survey results are a bit different:
The problem, of course, is that these responses are all "self-reported". Consider this:
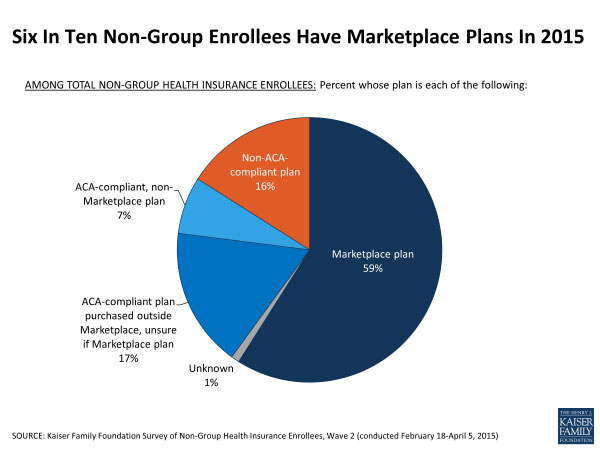
Another 17 percent purchased ACA-compliant plans from either an insurance company or a broker but say they are unsure whether their plan is a Marketplace plan or not
If they purchased a new policy directly from the insurance company, then yes, it should be ACA-compliant...but that doesn't necessarily mean it's a "Marketplace plan" since some companies are offering different policies off the exchanges than on the exchanges. However, all of these are required to be ACA-compliant anyway, so that's not really relevant. Furthermore, they may not have gone to Healthcare.Gov or a state exchange website, but it's possible that their broker did. They may have enrolled in a "Marketplace plan" whether they're aware of it or not.
The point is that when you include the 1% who didn't have a clue at all, 18% seem to be pretty unclear as to whether their policies were purchased on or off the ACA exchanges or whether they're ACA-compliant or not.
In any event, assuming that ACA-compliant, off-exchange policies make up the 3 smallest slices above, that would mean a ratio of 59%, 25% and 16%. In hard numbers, that would require the total individual market to be more like 18.5 million, so there's definitely a lot of uncertainty flying around.
- Somewhere between 4.5 - 8.5 million private individual market enrollees are newly-insured since the ACA exchanges launched.
This year’s open enrollment period saw a number of new buyers in the market — more than a third (36 percent) of those with ACA-compliant plans did not have non-group coverage in 2014. The largest share of this group was uninsured immediately prior to purchasing their current plan (72 percent of those new to the non-group market, or 26 percent of all those with ACA-compliant coverage). Among those who had non-group coverage in 2014, most chose to renew their existing plan rather than make a switch. About half (48 percent) of those currently in ACA-compliant plans say they renewed a health plan they had in 2014; only 15 percent say they switched between non-group plans.
Assuming around 18 million ACA-compliant individual enrollees (11 million exchange-based, 7 million off-exchange), that means that roughly 4.7 million people are newly insured for 2015.
Last year's KFF survey reported that 57% of exchange-based enrollees (around 4 million of the 7.1 million who actually paid their first premium) were newly insured. They didn't cover the newly insured numbers on the off-exchange market, but it's safe to assume that the newly insured numbers on that side were pretty minimal in 2014.
Does this mean that a net total of 8.7 million people are newly insured in private policies since the exchanges launched? Possibly, but not likely. Remember that again, this is all self-reported. Someone who was enrolled from January - September of 2014, for instance, then dropped their policy and then enrolled in a different policy in February 2015, for instance, might report that they were "previously uninsured" at the time of the survey. Likely to be a lot of double-counting between these numbers. Still, it certainly sounds like the answer to the question "How many people are newly insured in private, individual healthcare policies since the ACA exchanges launched" appears to be "somewhere between 4.7 - 8.7 million". Knock off a couple hundred thousand at both ends to be cautious and you get a range of 4.5 - 8.5 million.
- Only 30% of enrollees shopped around, but technical and education/outreach improvements could double this.
About seven in ten (69 percent) of those who renewed an ACA-compliant plan say they did not shop around before renewing. The most common reason for not shopping was that they were satisfied with their current plan (35 percent). About one in ten each say they were too busy or didn’t have time to shop (10 percent), they didn’t want to deal with the hassle of shopping (9 percent), or they didn’t think they could find a more affordable option (8 percent).
...nearly four in ten say it was difficult to set up an account with the marketplace (38 percent) and to compare the providers covered under each plan (37 percent).
...Personal help was also important this year, particularly for those new to the market or switching plans. Overall, about six in ten of those either new to the non-group market (60 percent) or those who switched plans this year (57 percent) report getting help with enrollment, while most of those who renewed an ACA-compliant 2014 plan say they completed the process on their own (63 percent).
Bear in mind that "shopping around" doesn't necessarily mean that you switch policies, it just means that you at least looked around to see what was available.
The whole theory behind the "invisible hand of the free market = lower prices for all" mindset is that competition allows the consumer to shop around and compare pricing and other factors. However, the "competition = lower prices" theory only works if the customers actually do shop around. This year only 30% did, which is either unimpressive or impressive depending on your perspective.
However, I see a huge upside in these results: In addition to the 30% who comparison shopped, another 27% are open to shopping around...but only if the benefits of doing so are explained to them and the process is further simplified.
I should also note another important factor: Last fall, Healthcare.Gov as well as most of the state exchanges made it too easy (in my view) to simply automatically renew their 2014 policies. People tend to be fairly lazy about this sort of thing, and by allowing them to just auto-renew, there was little incentive to get current enrollees to actually see what else was available.
To get a feel for just how much this can impact things, consider Rhode Island. HealthSourceRI was unique this year in that not only did they not offer any sort of auto-renew policy, the reason they didn't have one was a deliberate policy decision. Several states had no choice but to require 2014 enrollees to manually log back in and choose their plans all over again, because they had to scrap their old system and replace it (MA, MD, OR, NV). Unlike these states, Rhode Island could have allowed autorenewals but chose not to, preferring to require all enrollees to at least log in and look around a bit.
The result of this policy in Rhode Island?
62% of renewing individuals have selected a different plan for 2015
39% of renewing individuals have selected a plan with a different carrier for 2015
80% of renewing individuals have selected a plan in the same metal level for 2015; 6% of renewing individuals bought up by metal level for 2015, while 13% bought down by metal level for 2015
That's right: 2014 Rhode Island enrollees were more than twice as likely to shop around for their 2015 policies than in states which allowed them to renew their current plans without lifting a finger.
Food for thought for 2016.
- For all the fuss over "narrow networks", most people are more concerned with the cost of premiums and deductibles.
According to Kaiser's study, 60% of enrollees are concerned about their specific benefits and "network" size, which is sizeable...but 80% are concerned about the cost factor.
- In spite of all the hand-wringing over premium rates, deductibles and network size, 74% of ACA exchange enrollees give good or excellent ratings to their own policy, and 59% think it's a good or excellent value.
Even more impressive: These numbers are a bit higher than they were last year (up from 72% and 58% respectively).
Another noteworthy point: The "excellent/good" rating for non-ACA compliant policies (grandfathered/transitional) is higher (83%)...but the excellent/good value rating for those plans (49%) is lower than for ACA policies:
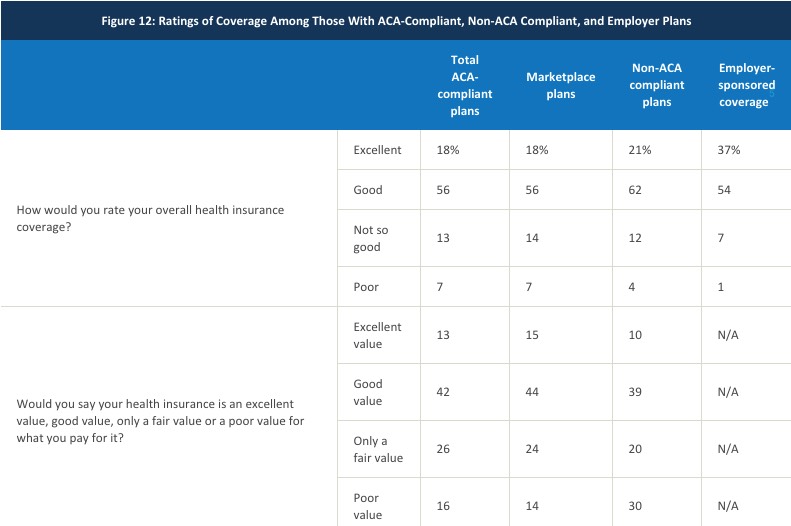
People with the "plans that they like" actually feel that those plans are a worse value than those with ACA policies...although obviously the fact that about half of the ACA enrollees are receiving federal tax credits and/or cost sharing reduction assistance certainly makes it easier to call it a "good value".
There's a whole mess of other "in the weeds" stuff in the Kaiser study, but this is the one which jumps out at me:
- 26% of those who have enrolled in ACA-compliant policies hate the ACA.
Before I start screaming "HYPOCRITES!!" at all of these folks, it's important to keep in mind that some of these people have no choice but to enroll in an ACA-compliant policy if they want healthcare coverage at all. Disagreeing with the law doesn't necessarily make them wrong to (grudgingly) comply with it.
Even so, the partisan breakout makes it very, very obvious that this is absolutely not about the ACA itself, but the "Obama" part of "Obamacare":
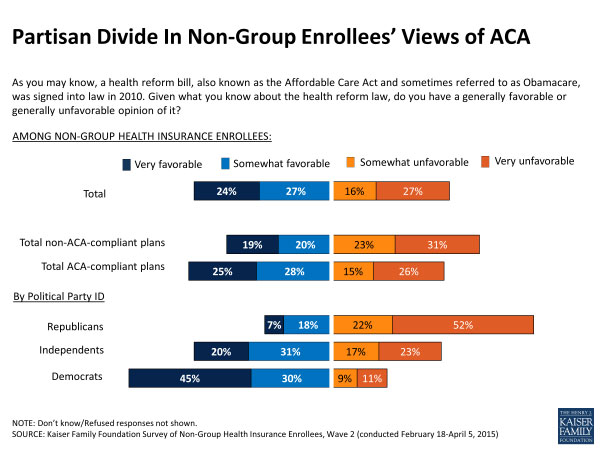
Yup. Over half of Republicans are die-hard opponents of the Affordable Care Act even as they're signing up for it. If you include those "somewhat opposed" it leaps to a whopping 74% of GOP enrollees. On the flip side, an almost identical 75% of Democratic enrollees support the ACA...while Independents are, as you'd imagine, right in the middle: 51% support / 40% oppose (the rest didn't express an opinion one way or the other).
And with that, I need to get back to my day job (I do have one, really...) Read the whole thing for more.
Advertisement
