

King v. Burwell, Red v. Blue & More Fun w/Numbers
Sat, 02/28/2015 - 9:48pm
OK, so here's a fun little King v. Burwell exercise:
- First, look at the official Democratic/Republican lean of all 37 states operating via Healthcare.Gov. For this, I used Gallup's 2013 Political Composition survey.
- Caveat: This may have changed significantly in the past year or so, and just because someone identifies with one party or the other (or neither) doesn't tell us their actual voting record or frequency)
- Then, let's sort the states by their red/blue lean, making some adjustments for states which don't seem to match up in practice with their "on paper" party lean (for instance, Viriginia has been trending blue recently, while Ohio, Wisconsin, West Virginia and Florida, which officially have more self-identified Democrats than Republicans, sure as hell seem to be on the red side in recent years (the same could be said of Michigan, but there's too strong a Dem advantage there to ignore).
- Next, let's plug in the total 2015 Open Enrollment Period QHP selection numbers for all 37 states
- Caveat 1: There's about 131,000 people missing from the total because we don't know the state breakdown of them yet
- Caveat 2: There's also about 90,000 people included who shouldn't be, because they haven't been subtracted yet on a state-by-state basis
- Caveat 3: I don't know whether New Mexico, Nevada and Oregon would be in the clear in the event of the Supreme Court ruling in favor of the King plaintiffs or not; they're listed but italicized for now.
- Then, let's assume that the 8.8 million people who enrolled in an HC.gov policy break out demographically the same way that their state population as a whole does (this is a major assumption...I have no idea how different the political demographics fo these 8.8 million people actually are from the total state population).
OK, with all that out of the way, what does it look like?
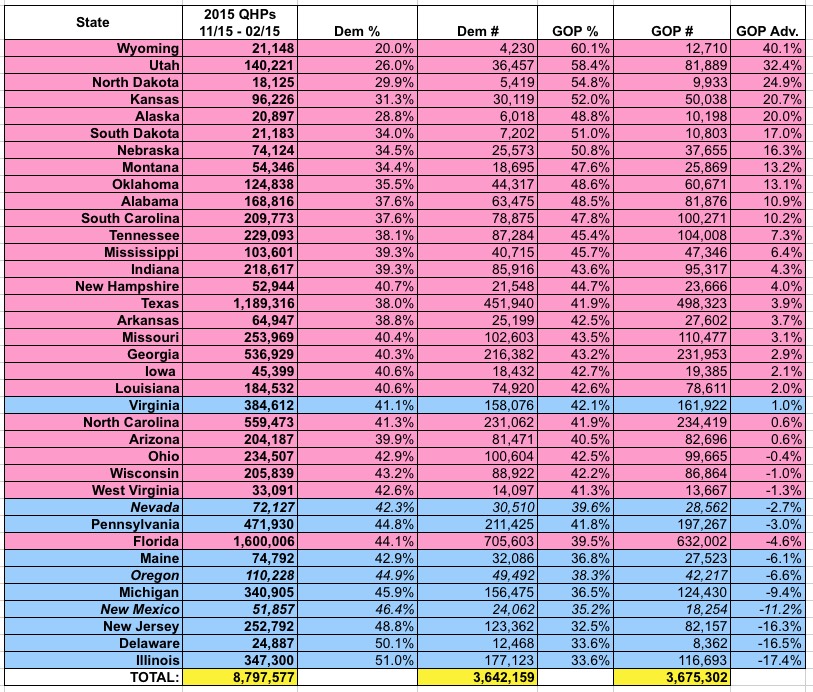
There are two things which immediately leap out at me. First, of course, is that 27 of the 37 states are GOP-leaning.
The other is, which I admit rather surprised me, is that the total enrolled populations of all 37 states combined is surprisingly close, with only a slight GOP-lean.
Of course, this leaves out the independent/unaffiliated group (17% of the total), and there's absolutely no way of knowing what the political leanings of the specific people enrolled in HC.gov policies are. In addition, if the SCOTUS tears away the federal tax subsidies, it would seriously impact far more people than just those actually enrolled in the QHPs.
Still, this at least starts to explain why Republicans are suddenly freaking out about the potential backlash of "winning" the King v. Burwell case. Presumably the vast majority of Democratic/Dem-leaning enrollees (and their family/friends) would blame the GOP for ruining their lives...the question is, what about the "indys" and Republicans in those states who are hurt by such a SCOTUS decision? Who would they blame (and would that blame actually be turned into action at the voting booth?)
Well, let's suppose that the Dems blame the GOP for tearing away their tax credits, the Republicans blame the Dems for making a drafting error in the first place and the indys split their blame between the two. In that case, everything pretty much cancels each other out, since there's roughly an equal number of each in the 37 combined states.
The thing is, this is an unusual situation. This isn't a theoretical benefit that the voters might receive soon; it's an existing benefit, brought to them by the Democratic Party exclusively for the past 2 years, which would now be being taken away by the Republican Party and their minions on the Supreme Court.
Given that context, I'm pretty sure it'll be more along the lines of:
- The Democratic enrollees will absolutely blame the GOP (9:1?)
- The Independent enrollees will probably blame the GOP 2:1
- The Republican enrollees will probably blame Obama 2:1
Again, take all of this with a huge grain of salt; there are more major caveats than you can shake a stick at. Having said that, assuming the table above is fairly close to the true state of ideological lean of the enrollees, that means that they'd likely blame the Republicans at roughly a 2:1 ratio...and unlike the Medicaid demographic (or even the higher-rung Medicaid Expansion demographic), those in the 138% - 400% FPL demographic tend to vote...and they'll be majorly P.O.'d.
Advertisement
