

The Long Game: What will the rest of 2015 look like?
Mon, 02/23/2015 - 9:26am
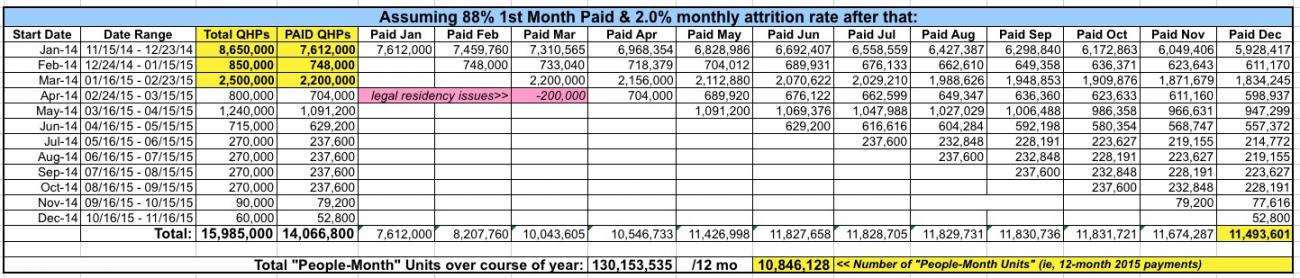
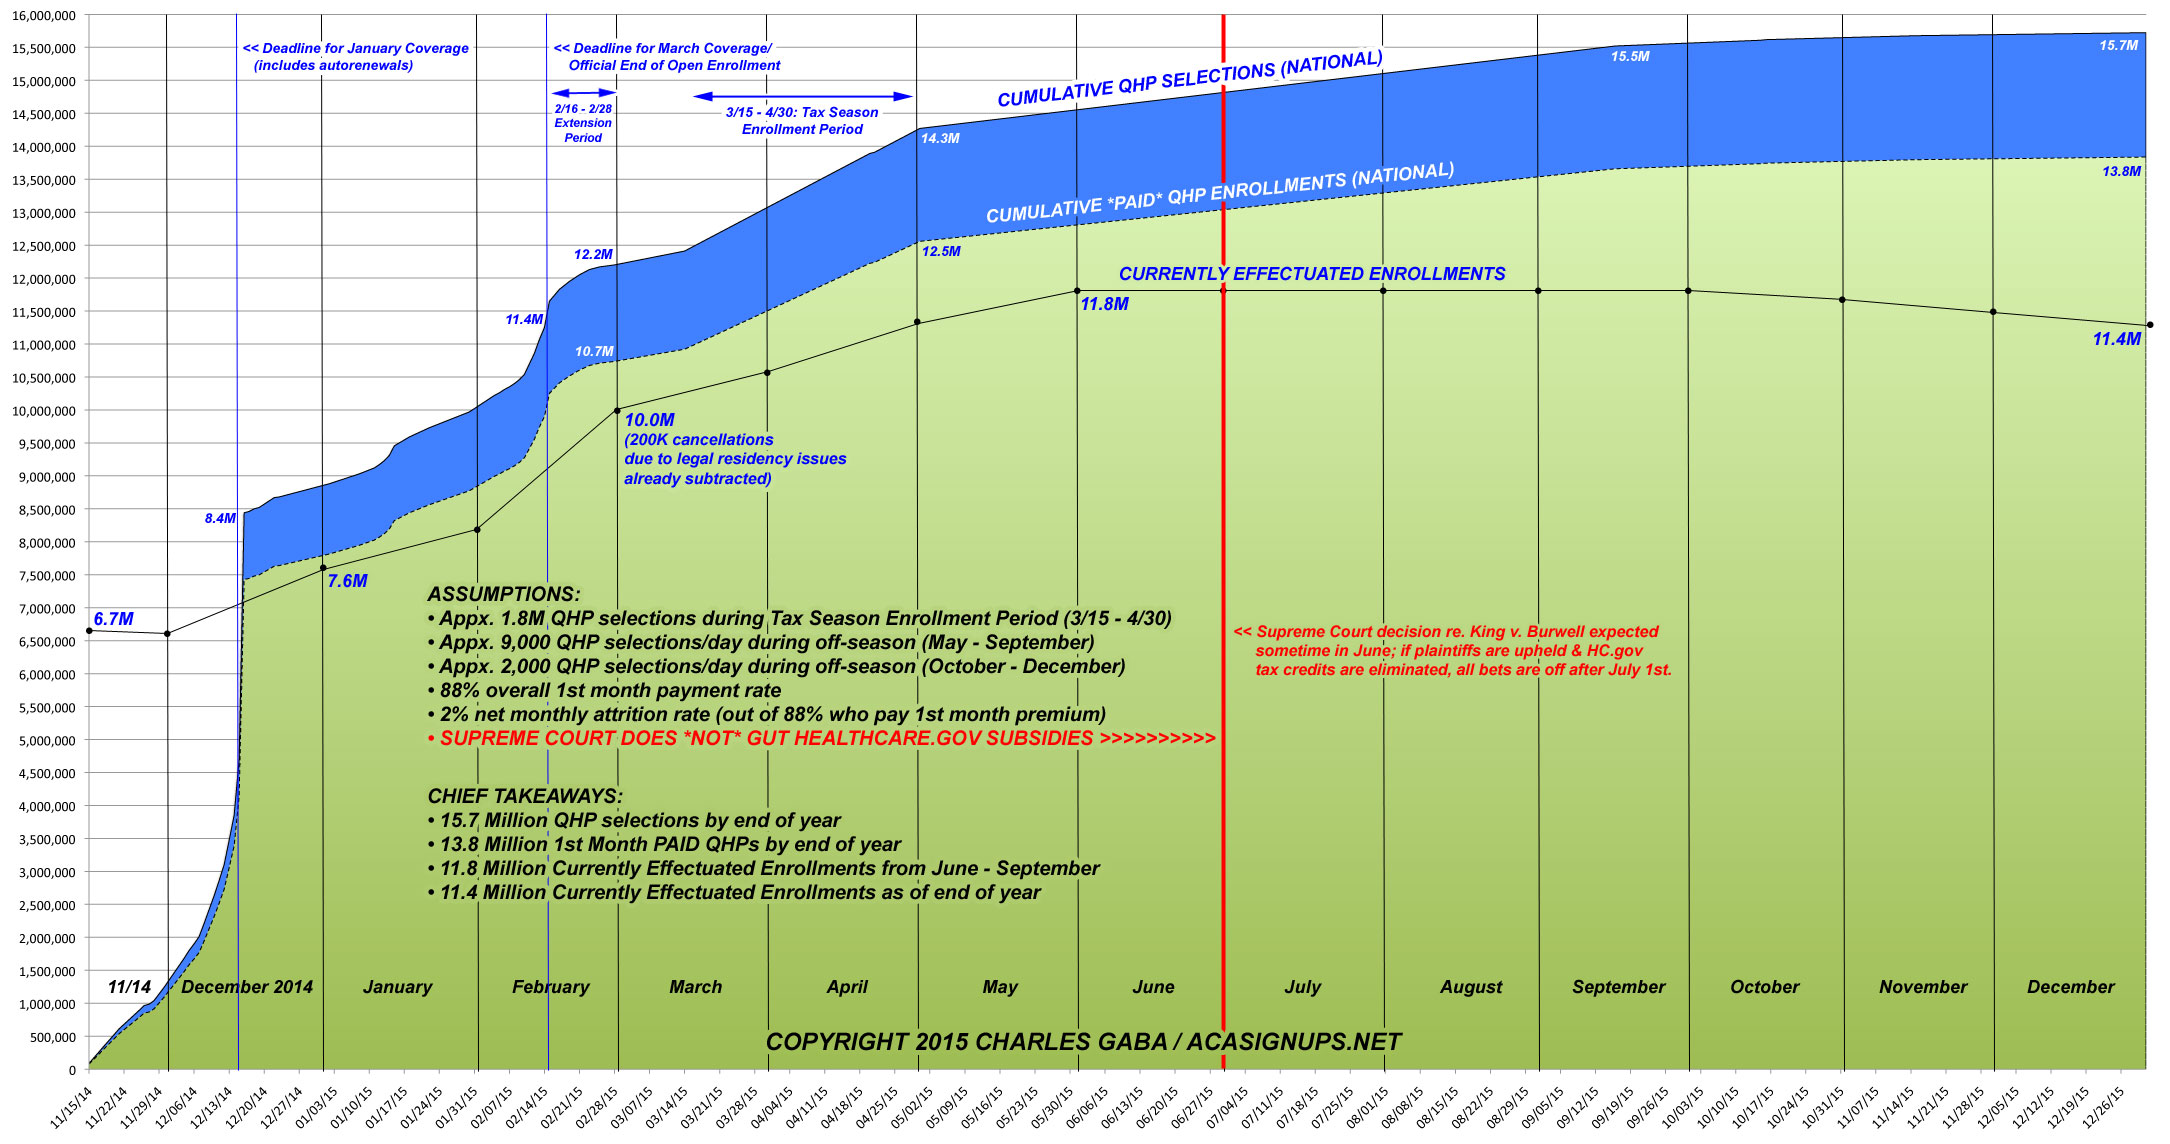
IMPORTANT!! The table and graph below make several important assumptions about how the rest of 2015 will play out:
- First, this assumes that another 1.8 million people nationally take advantage of the special "Tax Season" enrollment period recently announced by the HHS Dept. The exact date ranges differ for many of the state exchanges (from as early as February 17th in Washington State to as late as May 30th in Vermont), but for the most part we're talking about March 15th - April 30th. 1.8 million is complete dart-throwing on my part; the number of people nationally who are eligible to enroll during this period is somewhere between 0 - 6 million, so there's no way of knowing. 1.8 million just sounded reasonable to me.
- As always, I'm assuming that roughly 88% of those who select QHP policies end up paying at least the first month's premium.
- Last year, roughly 9,000 people per day (270K/month) were still selecting policies even during the off-season via qualifying life events (marriage, divorce, birth, income change, etc). I'm assuming a similar pattern this year after the tax season period, tapering off in the last few months as people wait for the 2016 enrollment period.
- Last year, there was an average net attrition rate of roughly 2% per month as people moved off of their exchange policies, partially/wholly cancelling out the additions, depending on the time of year. If 2015 follows a similar pattern, the number of actual effectuated enrollments should rise to around 11.8 million in June, hover there for most of the summer, and then start to drop off again towards the fall as cancellations start overtaking new enrollments.
- The single biggest assumption, however, is that the Supreme Court rules against the plaintiffs in the upcoming King v. Burwell court case. The case is scheduled to be argued in March, and the SCOTUS decision is expected in June. This means that any potential ruling against tax credits via the federal ACA exchange could be implemented as soon as July. If the Court rules for the plaintiffs and, therefore, orders the IRS to immediately stop issuing the monthly tax credits to up to 7.8 million people*, then the rest of the table/graph for the 2nd half of 2015 becomes completely irrelevant, as millions of people are forced to drop their policies and the entire private insurance market is forced into turmoil.
How many people? Well, let's assume that around 10% or so at the upper end are only receiving nominal tax credits--$10-$20 per month or so. If you're at that income level, losing a couple hundred bucks per year would be annoying, but it wouldn't hurt you too badly. However, that leaves perhaps 7 million people down the scale for whom having to cough up an average of $3,200/year more in taxes would be pretty devastating...and that's before the "death spiral" kicks in (you know, the one that didn't happen this year, so the Republican Party is determined to make it happen next year).
- Don't forget that these are ACA exchange-based private policies only. The off-exchange market will probably follow a similar pattern, but could be somewhat different as well.
*(assuming 11.8M effectuated enrollees as of June 1st, about 76% of these will be via HC.gov; of those about 87% will be receiving tax credits, or 7.8 million). Of course, that assumes that Nevada, Oregon and New Mexico all get screwed by King v. Burwell along with the other 34 states on HC.gov. If not, then the number will be slightly lower (perhaps 7.6 million or so).
With all that out of the way, here's how I foresee the rest of 2015 looking:
(Click below for full-size versions...warning: the Graph is HUGE)
Advertisement
