

The 2015 Medicaid/CHIP Graph
Fri, 11/28/2014 - 10:06pm
OK, I wasn't quite sure how to deal with the Medicaid Graph this year. On the one hand, there isn't any deadline or "open enrollment" period for enrolling in Medicaid/CHIP; it's year-round. On the other hand, there simply wasn't room to just keep the 2014 Graph running continuously, at least without making the relative scale between the QHP and Medicaid graphs completely out of whack.
In addition, as I noted when the September CMS Medicaid/CHIP report came out, my own estimate seemed to be running around 4.5% too high compared to the official government figures (they had 9.1 million + 950K from prior to 2014 as of 9/30 (around 10.05 million); I had it down as around 10.5 million, or 450K higher.
Therefore, I'm resolving both issues by picking up the 2015 graph right where the 2014 graph left off...but I've also knocked a couple hundred thousand off in order to at least partially account for the discrepancy. As a result, if you try putting the two side by side, there will be a mis-match of a few hundred thousand, but I can live with that.
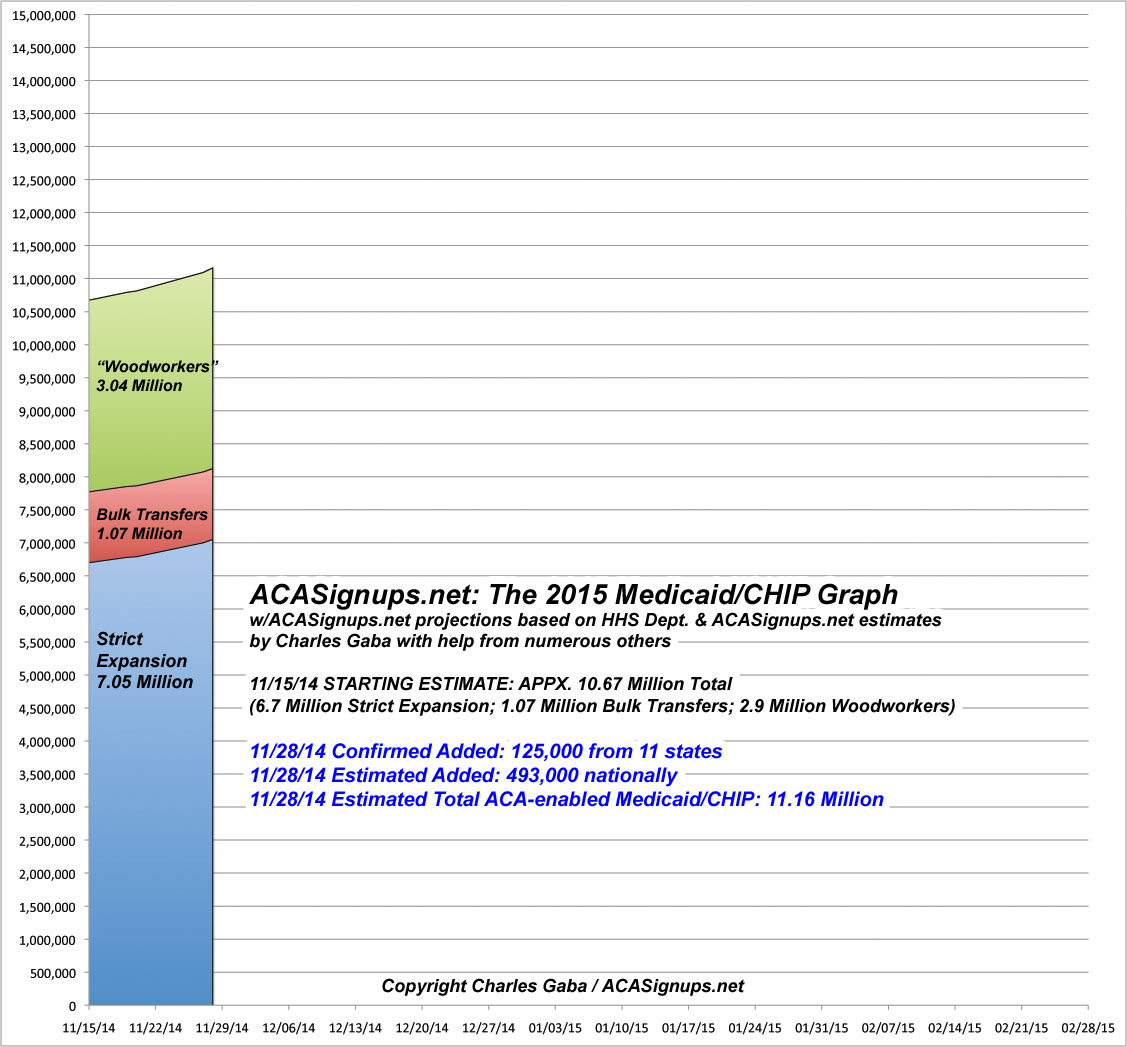
In any event, here's what it looks like at the moment:
How to support my healthcare wonkery:
1. Donate via ActBlue or PayPal
2. Subscribe via Substack.
3. Subscribe via Patreon.
Advertisement
