

Commonwealth Study: Dramatic Expansion/Non-expansion difference supports my own Medicaid estimates
Thu, 07/10/2014 - 3:18pm
The Commonwealth Fund study which is causing such a buzz today contains a lot of interesting data points. The one which is the most bothersome is this:
It's not terribly surprising that expansion states saw their uninsured rate drop more than non-expansion states, but this seems like too much of a difference (11% vs. 2%)...until you remember that this only applies to people in poverty...that is to say, only the Medicaid/CHIP data is relevant here, as noted by Jeffrey Young in his Huffington Post piece.
The actual Commonwealth Fund brief makes this clear:
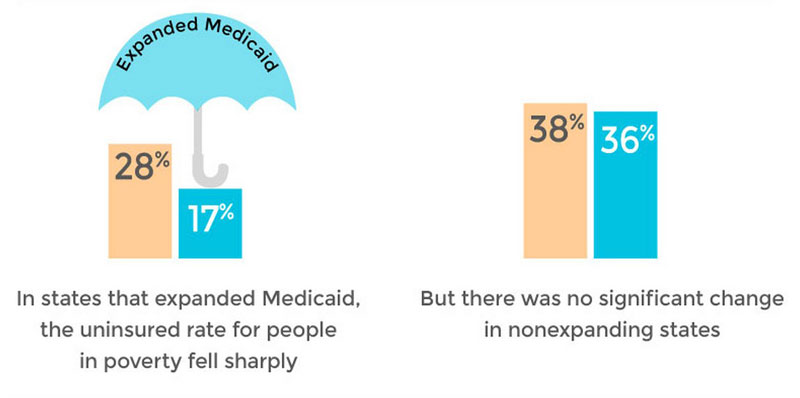
The decisions by states to expand Medicaid or not have had significant implications for the nation’s poorest people. In the 25 states that, along with the District of Columbia, had expanded their Medicaid programs by April, the uninsured rate for adults with incomes under 100 percent of the federal poverty level declined from 28 percent to 17 percent. In the states that had not expanded their programs, the rate remained essentially unchanged at 36 percent.
Got that? The 11 to 2 ratio only applies to those who fall into the pool of the poorest Americans; the Medicaid bracket (or, sadly, the Medicaid "hole" bracket for non-expansion states).
Why is this relevant to me specifically? Because, for months now I've been a bit uncertain as to just how accurate my own "ACA enabled Medicaid" tally is, for a variety of reasons: Irregularities in how the states report enrollments; the fact that some data is Medicaid "determinations" while other is actual "enrollments" and so forth.
In any event, my current breakdown is as follows: 5.86 million "strict expansion," 1.19 million "bulk transfers" and 2.52 million "woodworkers," for a total of around 9.57 million.
The first two categories (strict expansion & bulk transfers) only apply to expansion states. The third (woodworkers) are split between the 50 states (+DC). There are 26 states +DC which put through expansion, and 24 which haven't done so yet. I don't know the exact breakdown of Medicaid-eligible uninsured populations between the two groups (if you want to run the numbers, you can do so here), but assuming it's roughly 50/50, that would mean:
- 5.9 million would only be expansion states (“expansion only”)
- 1.2 million would also only be expansion states (“bulk transfers)
- 2.5 million would be “woodworkers”…split between all 50 states, in whatever ratio.
If you assume a 50/50 woodworker split, that’d be 87% in Expansion states vs. 13% in Non-Expansion states, or an 11.3: 1.7 ratio.
In other words, while my total Medicaid/CHIP numbers may be a bit high due to using "determinations" instead of "enrollments", it looks like I'm pretty damned close in terms of the ratio of the numbers.
Advertisement
