

Presenting the OFF-Season QHP Projection Chart (UPDATE)
Thu, 06/26/2014 - 12:35pm
I gave a general overview of the reasoning behind my 200K - 300K per month off-season QHP enrollment estimate a couple of weeks ago, but I didn't get around to actually plugging the numbers into a spreadsheet and running the calculations until today. Here's where things currently stand:
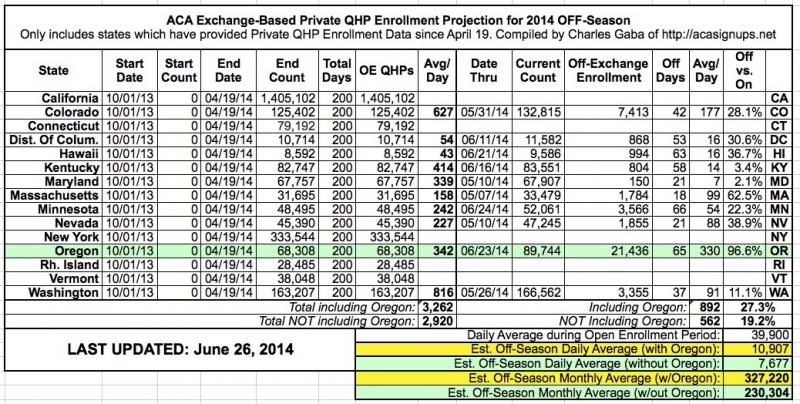
As you can see, just as I did with my enrollment period projections (which were consistently proven to be 99%+ accurate), I'm using the data provided by the state-run exchanges since April 19th as the basis for my "off-season" projections. Unfortunately, not only is the HHS Dept. refusing to provide their monthly enrollment reports during the off season (which I've ranted about several times), but New York isn't doing so either (I already asked), and so far there's no word from California, Connecticut, Rhode Island or Vermont.
I'm really hoping that California comes through with updated data; if they do so, that would instantly fill in about 18% of the national total, and I'd feel much more confident about my estimates, which are relying on just 10 smaller states at the moment. In addition, Oregon appears to be such an outlier that I'm running the numbers two ways: One estimate includes OR, the other doesn't.
Based on the data so far, as I said at the time, it looks like off-season QHP enrollments should end up running between 200K - 300K per month. This chart will be updated and the projection modified as more data comes in, of course.
UPDATE: OK, this is just plain spooky. Back on June 10th I gave a back-of-the-envelope estimate that low-end off-season QHP enrollments would be at least 200K/month (7K/day). A few days later, I quantified this a bit more, making it a range of somewhere between 210K - 320K/month (7K - 11K/day), give or take. Both of these were very rough estimates.
Then, yesterday, I actually plugged the hard numbers that we do have so far into a spreadsheet and posted the chart above; as you can see, this makes things even clearer: A lower-bound number of around 230,000/month, an upper-bound of around 327,000/month.
Here's the punchline:
@xpostfactoid1 @charles_gaba @DemFromCT @CitizenCohn Yea we had ~4m annually (333k/mo) who could churn in so those #s in line w that
— John Graves (@johngraves9) June 27, 2014
@xpostfactoid1 @charles_gaba @DemFromCT @CitizenCohn p.s.Gruber and I had a TPM piece explaining back-of-env. calcs: http://t.co/APtAuItw0e
— John Graves (@johngraves9) June 27, 2014
A few minutes later, after I responded that I wish I'd known of his piece earlier:
@charles_gaba @xpostfactoid1 @DemFromCT @CitizenCohn That sounds abt right to me; our 333k/mo was prob an upper bound on potential new enrl
— John Graves (@johngraves9) June 27, 2014
OK, that's just cool.
Oh, as an aside, Maryland should be releasing an updated report today which should help a bit...but I'm really hoping that California would come through. The above 10 states only cover around 8% of total enrollments; if CA releases their off-season data it would instantly move that up to 26%, which would make me far more confident in these estimates.
It's also important to note that whatever the May/June average is, it will likely drop somewhat as we move into late summer and the fall, because it's was propped up a bit in late Aril and all of May by the Nevada/Oregon open enrollment extensions, and there's a June COBRA extension nationally as well. So, if it's around 300K now, it will probably drop down to the 200K's a bit later on.
UPDATE x2: OK, Maryland just released their latest enrollment update report, and while the raw numbers aren't huge, the percent jump is quite impressive (from 2% to over 30% of the OE average), which means that the overall projection has increased accordingly; it now stands between 270K - 360K per month. Remember, this estimated range will move up or down as more hard data comes in, especially if/when California releases some new numbers.
Advertisement
