

The Final* Graph of the 2014 Open Enrollment Period
Sun, 05/04/2014 - 3:03pm
In addition to the March/April HHS report being released on Thursday, the CMS Dept. decided to take care of everything in one shot and also released the March (only...no April data included) CMS report as well.
As a result, I just finished plugging in the data from both reports onto the Medicaid/CHIP spreadsheet (followed, of course, by having to go through and delete out big chunks of the data from one or the other to avoid double-counting or any Medicaid renewals).
Normally each of these reports (which are usually released a couple of weeks apart) bumps the new Medicaid/CHIP numbers up by a half-million or so apiece after separating out the renewals & baseline churn. This time around, the impact looks much more dramatic because 1) both reports were added on the same day, 2) the HHS report includes 2/3 of April as well as March and 3) there appears to have been a bit of a spike in Medicaid enrollments as the 3/31 open enrollment deadline approached just as there was for QHPs (this may sound strange since there's no deadline for Medicaid, but a lot of people might not have realized that, and the frenzied outreach effort probably swept up a lot of potential Medicaid enrollees in the final weeks of March as well).
In any event, the net result of all of these factors is a significant spike in new Medicaid determinations. AGAIN, it's important to understand that the spreadsheet and graph display how many people were newly determined eligible for Medicaid/CHIP, not necessarily how many actually enrolled in the programs. Until recently I naively assumed that pretty much 100% of those determined eligible for Medicaid would finish the process (since they already had to jump through hoops to get to that point, and it doesn't cost them anything to do so), but apparently that's not the case. This is why the actual net increase in people enrolled in Medicaid seems to always lag a couple million behind the determination number shown on the graph.
With that in mind, after removing all of the redeterminations/renewals, baseline churn, double-counted entries and so forth, here's my new estimates of new, ACA-specific Medicaid/CHIP determinations:
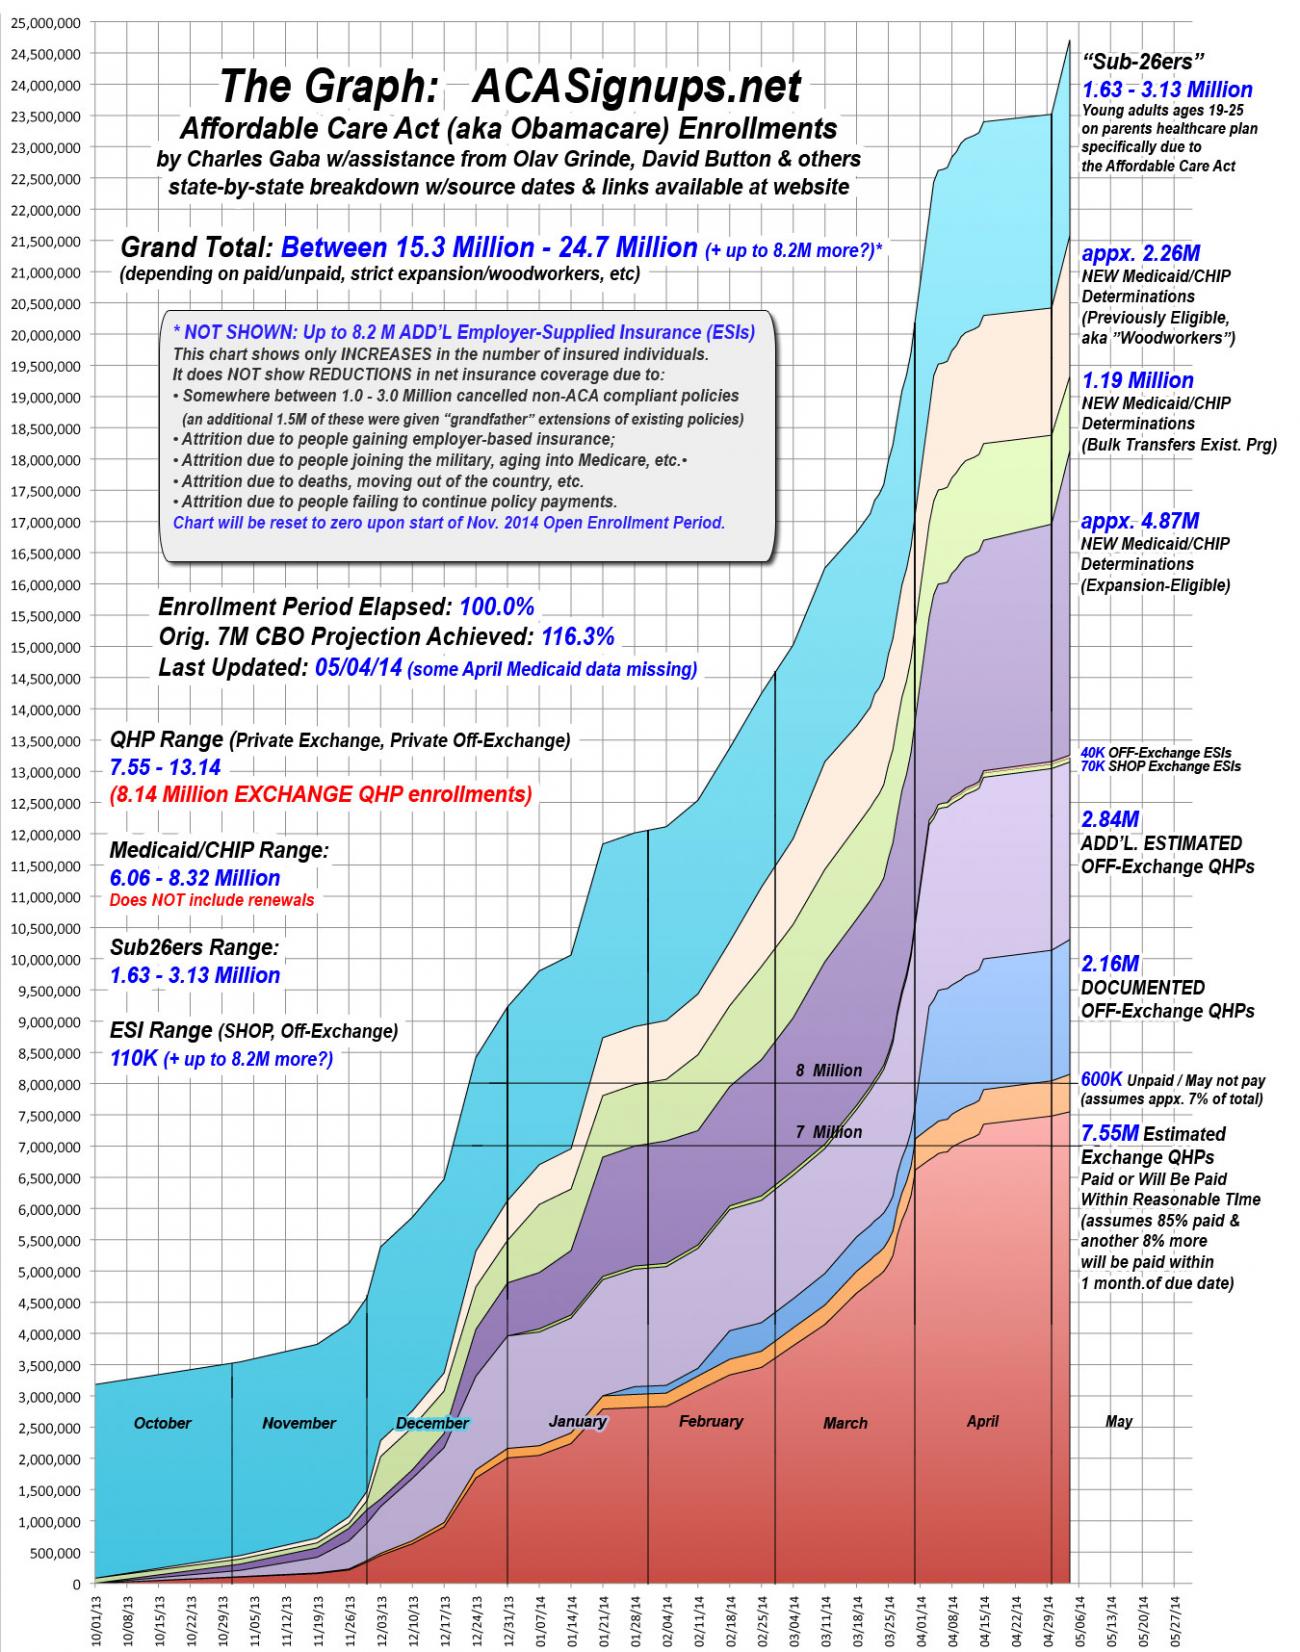
- Strict Expansion: 4.87 million (about 233K of the increase is due to category correction from the "bulk transfer" column)
- Bulk Transfers: 1.19 million (dropped by 233K due to category correction to the "strict expansion" column)
- Woodworkers: 2.26 million
Previously, the tallies were 3.80M, 1.42M and 2.04M respectively, so this means an overall Medicaid/CHIP determinations increase of about 1.05 million people in March and part of April.
NOTE: I'm aware that these Medicaid/CHIP increases actually happened in March & April, not the first few days of May, but as always, I just don't feel like going back and updating prior dates retroactively. As a result, the graph appears somewhat distorted even though the final totals are the same either way.
In addition, there's a couple of other noteworthy updates:
- It turns out that the 31,000 adult children of Military parents in the TRICARE program I wrote about the other day (19-25 years old) actually are all due to ACA provisions, so I've added them to the "Sub26ers" column. This doesn't have much impact; mostly just a rounding error, but it's worth noting since the sub26er number has stayed stable for so long.
- Finally, now that we're past the 4/30 extension deadline, and given all the "But how many have PAID???" fuss caused by that idiotic GOP House Energy/Commerce Committee report shoved out last week, I've reconfigured the QHP spreadsheet to include a distinct "Paid Exchange QHP Percent" column so that every state can be modified as data comes in.
As you can see, for states which have released an actual number or percentage, I've used those (100% for Washington & Massachusetts; 94% for West Virginia, 91% for Rhode Island and so forth). For the states which haven't issued any particular percentage, I'm going with my standard "93% paid or will pay" figure. The one exception to these rules is California, which gave 85% as their paid percentage...but that was over a week ago, so I'm assuming this is up to 90% by now. I'll adjust individual states as appropriate when fresh data is released.
*(In the end, there will be a few more minor updates to QHPs (although I've already baked in an extra estimated 115K into the mix from 4/20 through the end of May), and of course Medicaid and other no-deadline updates will show up throughout the summer, but this is effectively the final Graph of the first open enrollment period.)
The final numbers for the 2014 open enrollment period (w/extensions) should end up being very close to:
- Total Exchange QHPs: 8.14M
- PAID Exchange QHPs: 7.55M or higher
- OFF-exchange QHPs: 5.0M or higher
- SHOP ESIs: 70K or higher
- OFF-exchange ESI: a bare minimum of 40K, possibly several million
- New Medicaid/CHIP (Strict Expansion): 4.87M
- New Medicaid/CHIP (Bulk Transfers): 1.19M
- New Medicaid/CHIP (Woodworkers): 2.26M
- Sub26ers: up to 3.13M
Total Range depending on your definition of what "counts": 15.3M - 24.7M
Advertisement
