

March QHP Enrollment Projections: Avalere, the House Energy & Commerce Committee and Me
Thu, 03/13/2014 - 9:16am
A couple of days ago, Avalere Health, with whom I've alternately butted heads with and agreed with on all things Medicaid-related, has issued their QHP projection: They're calling for around 5.4 million total. In order to hit that number, the March average would be around 38,600/day.
Avalere is basing their projection primarily on the Medicare Part D enrollment pattern back in 2006. They could very well be correct, but there's also some key differences between that situation and this one (the most obvious one: Medicare enrollments were presumably mainly limited to those over 65, whereas it's the "Young Invincibles" that are the primary target at the moment). However, I'm not going to pooh-pooh their projection either, as there are many similarities between the two as well: Both were/are large, national government healthcare enrollment programs, with a 6-month limited enrollment period, a financial penalty for not enrolling by the deadline and so on.
Avalere's methodology was pretty straightforward: they noted that in the case of Med Part D, 22% of the total number who enrolled waited until the last month to sign up. I believe what they're referring to is in the 2nd chart (the bar graph) on the first page of this PDF from the Kaiser Family Foundation:
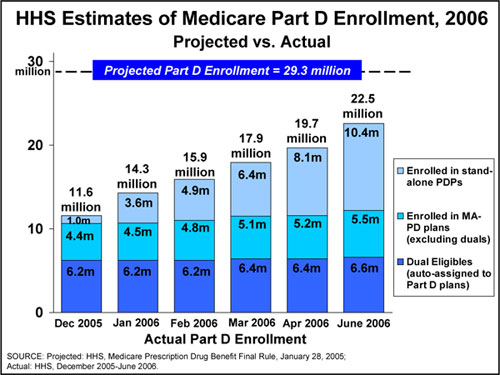
From what I can tell, it looks like only the "Enrolled in stand-lone PDPs" numbers in the upper section (10.4m) are relevant here--the "Dual Eligibles" and "MA-PD" enrollments appear to be something done automatically or otherwise aren't the same sort of voluntary enrollment process done by the individual themselves. If you just use the top numbers, you see that "June" had 2.3 million enrollees out of 10.4 million total, or around 22%. This seems to be the basis for Avalere's projection, and they could be correct.
I was also recently given access to a new memo released by the Committee on Energy and Commerce Democratic Staff (PDF), which uses the exact same comparison of the ACA vs. the 2006 Medicare Part D experience to draw a very different conclusion:
This memorandum compares the pace of enrollment in the new federal and state exchanges under the Affordable Care Act (ACA) with the pace of enrollment in Medicare Part D in that program’s first year. It finds that Americans are signing up for health insurance under the ACA at a faster rate than seniors signed up for Medicare Part D.
The Congressional Budget Office (CBO) estimated that 23 million seniors would sign up for prescription drug coverage under Medicare Part D during the first enrollment period. By the end of April 2006, with two weeks left in the open enrollment period and 92% of the open enrollment period completed, 13.3 million seniors had chosen to enroll. This represented 58% of CBO’s projected enrollment. By the end of the Part D open enrollment period on May 15, 2006, Part D enrollment was just 70% of the enrollment estimated by CBO.
...As the Bush Administration prepared for the opening of enrollment in Medicare Part D, the Congressional Budget Office predicted 29 million seniors would enroll for coverage in 2006.1
CBO estimated that 6.2 million of those beneficiaries would be dual eligible enrollees who were automatically enrolled in a drug plan and that the remaining 23 million would be individuals who chose to sign up for a Medicare Part D plan or Medicare Advantage drug plan.
But actual enrollment prior to January 1, 2006 – the first day of coverage – was well below these estimates: only 5.4 million people had chosen to enroll in Part D plans under traditional Medicare or Medicare Advantage.2 These 5.4 million represented only 23% of the 23 million beneficiaries that CBO estimated would sign up by the end of the open enrollment period.3
Despite these low estimates, Republicans were optimistic, with Department of Health and Human Services (HHS) Secretary Mike Leavitt telling reporters that the Administration was “well on track to meet our goal of enrolling 28 million to 30 million the first year.”4
By the end of April 2006 – with two weeks to go in the Part D open enrollment period – 13.3 million seniors had enrolled, representing 58% of total estimated enrollment.5
By May 15, 2006, when the enrollment period ended, the number of seniors choosing to enroll in Part D plans increased to 15.9 million.6
The 15.9 million seniors voluntarily enrolled in Part D at the end of the open enrollment period represented only 70% of the total first-year enrollment expected by CBO and the Administration.7
This memo is looking at the same data from a very different perspective: Not so much the total number of enrollments, but what percent of the original projected number is achieved. This isn't so much about projecting the ACA QHP tally as it's about pointing out that President Bush's 2006 Medicare Part D enrollment program missed their projections by more than the ACA is likely to, and no one seemed to make too much of a fuss about it at the time.
What's more interesting to me is that Avalere Health only used the "Standalone PDP" enrollments, while the Dem. Energy/Commerce Committee memo includes both "Standalone PDP" and "Medicare Advantage" enrollments in theirs. I have no idea which on these is more appropriate to use, if either. I will say that if you add the "Medicare Advantage" enrollees into Avalere's calculation, that 22% in the last month drops down to 16.4% (2.6 million out of 15.9 million total). If Avalere were to use that ratio, their 5.4 million projection would be lower, at around 5.07 million, but again, I don't know enough about the Medicare Part D program to speculate about which is the appropriate comparison.
So, what about my own projection for March?
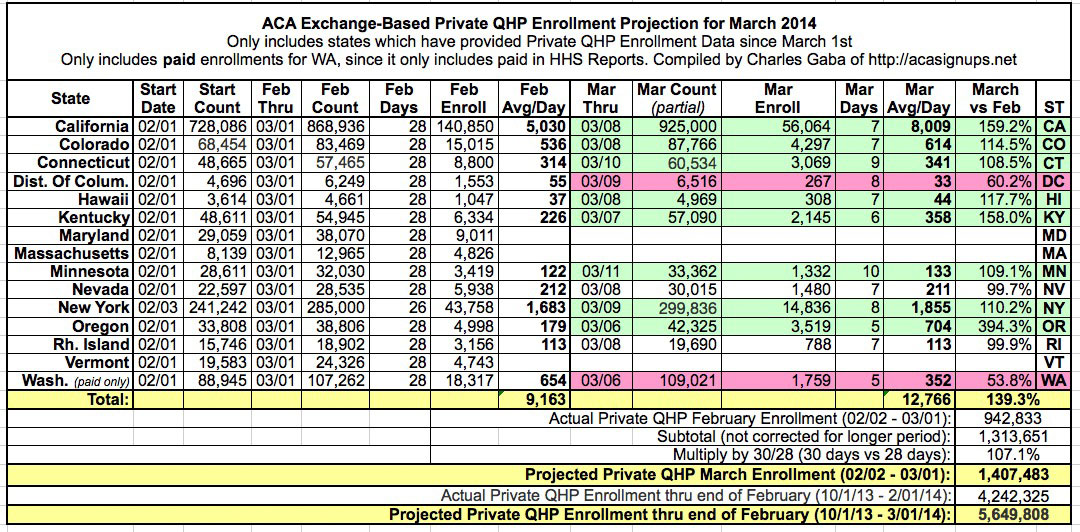
Well, now that I've resolved the mystery of the "missing" 40,000 New York enrollments, I've been able to put together a very preliminary projection for the final March exchange-based QHP enrollment tally.
I cannot stress this enough: This is not my final projection, and the number will be bouncing around from day to day as new actual data comes in from the various states. Even a small change in one of the larger states could move the needle dramatically higher or lower. In addition, enrollments are expected to ramp up heavily in the final week or so of March, so the 3rd and 4th week could easily be double, triple or quadruple those of the 1st and 2nd weeks. Unfortunately my data from December (the most obvious comparison) isn't broken out by date clearly enough to use that as a base.
Having said that, as of March 13, it's looking like roughly 1.41 million in March, for a total of 5.65 million as of 3/31.
I also want to clarify that the chart below does NOT include any sort of late-March surge yet, which is going to be the trickiest thing to judge. I'll try and add that factor in starting next week and will adjust accordingly as data and trends make themselves clearer.
Advertisement
