

States by the Numbers: Enrollments as Percent of Uninsured vs CMS Projections
Thu, 02/13/2014 - 3:21pm
OK, now that the January numbers are out, let's take a look and see how the individual states are doing. The wonderful Kaiser Family Foundation has a much more sophisticated version of this, but my spreadsheet has two features theirs doesn't: Ugly color-coded cells...and more recent enrollment data for 13 states.
While including post-February 1st data fro some states but not for others does give a bit of an unfair advantage to those states, it's still worth taking a look at to see how the states are faring.
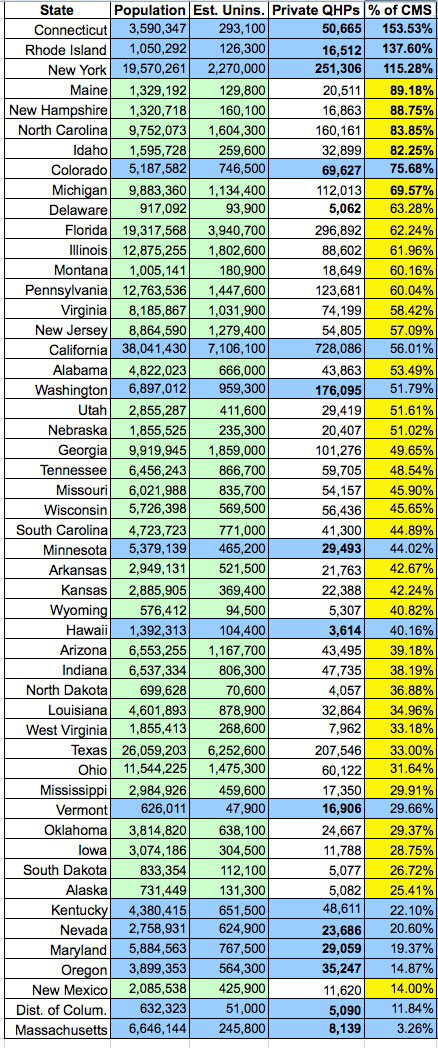
First, let's use the official CMS Projection percentages. These absurdness of these numbers has already been discussed repeatedly, so I won't rehash that here, but we should at least check it out before looking at a more rational measurement.
Using the CMS projections, Connecticut, Rhode Island and New York have all already exceeded their March 31st targets; Connecticut in particular is kicking major ass, and should easily double their original projection. Six additional states (Maine, New Hampshire, North Carolina, Idaho, Colorado and Michigan) are also ahead of their goals already (yes, we're at 73% of the enrollment period now, but we were only at 68% as of February 1st, the date that most of the states are tallied through). And yes, for purposes of these charts, I'm including unpaid enrollments for the reasons I discussed this morning.
At the opposite end, the worst-performing states (using the CMS numbers) are Maryland, Oregon, New Mexico, DC and coming in dead last...Massachusetts. The irony of Massachusetts, the birthplace of "Obamacare" (the Affordable Care Act), having the worst performance out of all 50 states (+DC) is not lost on me. On the other hand, MA also started out with the lowest uninsured rate in the country to begin with...due to "Romneycare", the father of "Obamacare", so perhaps this isn't so surprising after all.
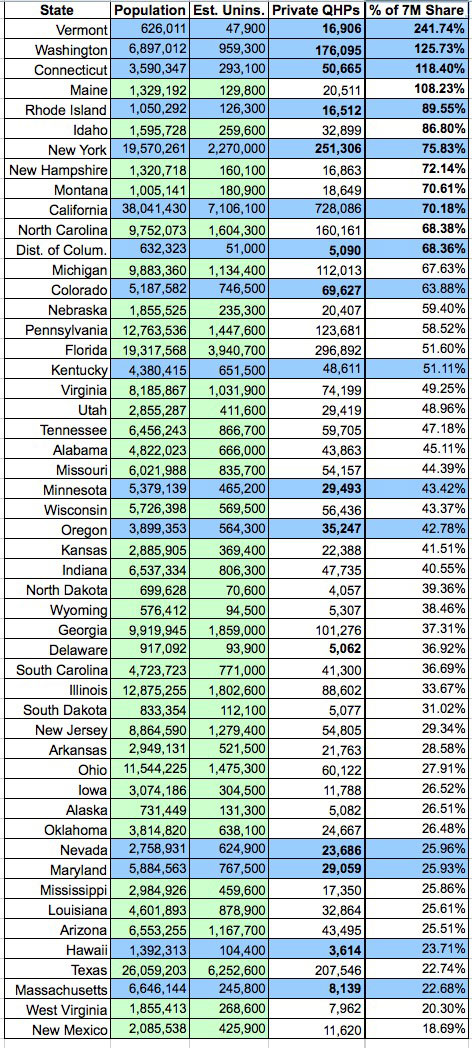
OK, with that out of the way, let's go with a far more sensible way of ranking state performance: The percentage of each states share of the total uninsured population. To review, for this measurement I took the total number of people that the CBO estimated would enroll in Private QHPs via the ACA exchanges in the first year (7 million) and divided it by the total estimated number of uninsured people in the country (about 48.3 million, according to the Kaiser Family Foundation). This gives you about 14.6% of the total uninsured nationally. Then, I just took 14.6% of each state's individual uninsured number to give a much more reasonable goal for March 31st.
When you rank the states this way, things look very different. Connecticut, Maine, New York, New Hampshire and North Carolina are still ranked very highly...but Vermont is annihilating everyone else, and look at the District of Columbia, which jumps from the 50th (out of 51) all the way up to 12th place.
Why such a dramatic change for DC? Simple...the CMS expected them to enroll 84% of their total uninsured population instead of the more reasonable 14.6%. I guess they figured that with the White House and Capitol Building being right next door there'd be a lot of pressure to sign up the surrounding neighborhood or something. On the other hand, Massachusetts still ranks 48th, so perhaps image wasn't an issue after all.
Interestingly, Kentucky, which has received so much praise for being an ACA-hostile state running a smooth & seamless exchange operation, actually only shows decent-but-not-great results, at 51% of target.
Anyway, using this method I'd group the states together as follows:
Past the Finish Line (over 100% already):
- Vermont, Washington, Connecticut, Maine
Overachievers (over 68% as of 2/1):
- Rhode Island, Idaho, New York, New Hampshire, Montana, California, North Carolina, District of Columbia
Solid Performers (50-68%)
- Michigan, Colorado, Nebraska, Pennsylvania, Florida, Kentucky
Middle of the Pack (30-50%):
- Virginia, Utah, Tennessee, Alabama, Missouri, Minnesota, Wisconsin, Oregon, Kansas, Indiana, North Dakota, Wyoming, Georgia, Delaware, South Carolina, Illinois, South Dakota
Slackers (25-30%):
- New Jersey, Arkansas, Ohio, Iowa, Alaska, Oklahoma, Nevada, Maryland, Mississippi, Louisiana, Arizona
Bringing up the Rear (under 25%):
- Hawaii, Texas, Massachusetts, West Virginia and New Mexico
Advertisement
