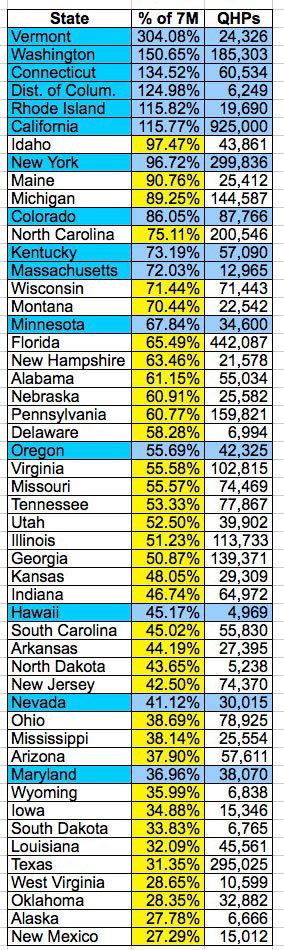
Here's all 50 states, sorted by their achievement of sensible "% of 7M" QHP enrollment goals (as opposed to the CMS's state-by-state projections, which never made much sense).
Two caveats: First, most of the state-based exchanges (blue rows) have an unfair advantage, as their numbers include some post-3/01 data. However, this should still give a good general sense of how the states are doing going into the home stretch. Second, all QHP numbers shown include unpaid enrollments, even for states which have broken them out; this seemed more consistent to me (and yes, I realize the contradiction in going for consistency on that front while still including post-February data on some states, but what the heck).
Anyway, as you can see, the state exchanges are definitiely in the lead:
--Vermont is crushing everyone else, with more than 300% of their fair share of the 7 million figure enrolled
--Washington, Connecticut, DC, Rhode Island and California, all state-based exchanges are all also above their "7M CBO" projections
--4 more states are also overperforming (that is, above the 89% mark; the enrollment period is 89% of the way through as of today): Idaho, New York, Maine and Michigan
--Interestingly, even though the Massachusetts and Oregon exchange websites are still complete messes, both states are actually "peforming" quite well now in terms of actual enrollments based on their reasonable percentage of the total uninsured nationally. In both cases, the states wisely made the decision to pour a ton of resources into manually processing enrollments instead of focusing purely on fixing the websites. While neither should be cheering, this tactic does seem to be acting as a pretty effective workaround.
--Meanwhile, the other 3 troubled websites, Hawaii, Nevada and Maryland, are indeed in the lower half of the list...but amazingly, Hawaii (with arguably the worst-running exchange) is above the other two, based purely on their extremely low uninsured population to begin with.
--Finally, bringing up the rear are mostly the usual suspects: Wyoming, Iowa, South Dakota, Louisiana, Texas, West Virginia, Oklahoma and Alaska. The only surprise (to me) here is to see New Mexico coming in dead last; as far as I know, NM's political climate should be fairly ACA-friendly, but so be it.
The February HHS Report included some especially confusing numbers out of the two largest state-run exchanges, California and New York, as both seemed shockingly low given how successful they both seemed to be doing in the first half of the month.
In the case of California, they were kicking serious ass in the first half of February, averaging around 7,200 QHP enrollments per day. Unfortunately, a few days later the CoveredCA exchange was hit with a very nasty technical problem which brought things to a standstill for not the 3 days that I thought, but 5 days. Result? The daily average dropped from 7,200/day in the first half to only 2,800/day for the second half of the month:
Enrollment in Obamacare coverage slowed last month in California, hurt by a recent website outage.
New federal data show 868,936 Californians signed up for health insurance in the state's exchange through March 1.
OK, now that I've resolved the 290K discrepancy from the HHS report (short answer: they corrected the report sometime yesterday, but the total hasn't changed), and have confirmed that someone from HHS/CMS is checking on the 40K New York QHP discrepancy, I've finally been able to update both The Spreadsheets (QHP and Medicaid) and The Graph with the latest data. Here's where things stand as of the morning of March 12th:
PRIVATE QHP ENROLLMENTS:
Exchange-based, Paid or Unpaid for Legitimate Reasons Only: 3.91 Million
Exchange-based, Including Unpaid Enrollments: 4.45 Million (this is the figure used to measure against the CBO 6M/7M projections)
Do me a favor. Go to the February HHS Report right now, scroll down to pages 21 & 22, and enter the numbers in Column 5. Go ahead, I'll wait.
Done? OK, according to the HHS Dept., when you tally up all of the Medicaid/CHIP determinations in Column 5 from both pages, according to the report, the grand total are supposed to be 4,377,932.
The subtotals (2,706,404 for the State-Based Marketplaces and 1,378,871 for the Federal Marketplace) all tally up correctly.
However, when you add the two together, guess what?
2,706,404 + 1,378,871 does not equal 4,377,932.
In fact, if you add those two together you get 4,085,275, over 290,000 less.
What's the deal?
UPDATE: Just received the following responses via Twitter:
@charles_gaba We updated the 2.7M number to be 2,999,061.
I ran into a similar issue a month ago, and thought I had straightened it out, but there's a major disconnect between the official HHS numbers for New York and the NY State of Health press release data.
According to HHS, New York only enrolled 33,328 people in February:
Colorado's offiicial metrics press release from last week only runs through March 1st, but contributor deaconblues found an interesting county-by-county breakdown which runs through the 8th. No Medicaid data, but the QHP number is up to 87,766, a 2,885 increase over a week earlier.
Y'know, no one wants up-to-date data more than me, but did Rhode Island really have to release their latest state enrollment data TODAY, while I'm still in the middle of compiling/updating the HHS report???
Anyway, They're up to 16,345 paid + 3,345 unpaid QHPs, and 48,602 new Medicaid enrollments, plus some SHOP updates. Yeesh.
Enrollment data (Oct. 1, 2013 through March 8, 2014)
Total HealthSource RI enrollments (including those who have not yet paid): 19,690
Paid enrollments: 16,345
Medicaid enrollments (per EOHHS): 48,602
Small employer applications initiated: 1,132
Small employer enrollment: 133 (these 133 employers represent 491 covered employees and 795 covered lives)
OK, as noted a little earlier, I underestimated the February HHS Report for Exchange-based Private QHP enrollment by about 4.2%:
My Projection: 902,800 (4.202 million total)
Actual Enrollments: 942,833 (4.242 million total)
I'm perfectly happy to have underestimated. As for where the extra 40,000 enrollments came from, my initial guess would be that California, in particular, started ramping up their big March blitz a bit earlier and more successfully than I figured, which, again, I'm absolutely fine with.Update: Nope, actually, California's numbers plummetted in the 2nd half of Feb due to that ugly technical outage; see below for details.
I'm busily plugging the new enrollment numbers into the spreadsheet even as I type this, and will be updating with various notes and observations, so keep checking in.
OK, I've entered the QHP data; a couple of things to note:
UPDATE: On the down side, I was off by 4% this time around.
On the up side, I UNDERESTIMATED:
Actual Feb. enrollments: 942,833, for a total of 4,242,325 thru 3/01/14.
Sarah Kliff at Vox just announced that the February HHS report is expected to be released today at around 4:00pm. A few items in anticipation of that:
As I've noted several times, I'm projecting the report to total around 902,000 exchange-based private QHP enrollments for the month of February (technically 2/02 - 3/01)
If accurate, this would bring the cumulative total of exchange-based private QHP enrollments to 4.202 million (from 10/1/13 - 3/01/14)
From the data I have, the average daily enrollment rate in February was almost identical to that of January, which had about 1.146 million QHP enrollments. HOWEVER, the January report included five weeks of data (12/28 - 2/01), while the February report will only include four weeks (2/02 - 3/01). Therefore, even at the same daily average, it'll be about 20% lower no matter what.
Don't be surprised if Peter Lee of CoveredCA decides to steal some thunder by announcing that California has enrolled 1,000,000 QHPs all by itself either today or tomorrow. However, that would include the past 10 days, while the HHS number will only run thru 3/01.
If you want to get REALLY specific, call it 902,800 and 4,202,292.
I've been dead-on target 6 times in a row without hyping up my projections beforehand. This time I am hyping myself up beforehand, so I'll probably be way off...but as long as I've UNDERestimated the tally, I'll be perfectly fine with that...
The report will be released in about 5 minutes, but my kid gets home from school in about 10, so it'll be a good 20 minutes before I can really post anything. Feel free to follow Sarah Kliff of Vox in the meantime!


 The February HHS Report included some especially confusing numbers out of the two largest state-run exchanges, California and New York, as both seemed shockingly low given how successful they both seemed to be doing in the first half of the month.
 Colorado's offiicial metrics press release from last week only runs through March 1st, but contributor deaconblues found an interesting county-by-county breakdown which runs through the 8th. No Medicaid data, but the QHP number is up to 87,766, a 2,885 increase over a week earlier.