

CMS quietly releases Effectuated Enrollment report for first half of 2020
Mon, 12/28/2020 - 3:48pm
Normally I receive notices about these types of data reports directly from CMS via their mailing list, but this time around it wasn't emailed and in fact isn't even posted on the CMS newsroom archive (at least not yet). Fortunately, my eagle-eyed colleague Andrew Sprung grabbed the link from a Health Affairs article and wrote up his own analysis of it.
The official 2020 Open Enrollment Period QHP selection total was just over 11.4 million (down just 0.3% from OEP 2019). However, as happens every year, the number of people who select policies during Open Enrollment is not the same as the number who are actually enrolled in effectuated healthcare policies. Around 10% of those who select policies never pay their first monthly premium for one reason or another, and are therefore never actually enrolled at all. For the other 90% or so, some drop their coverage after anywhere from one to twelve months for various reasons, while others stay enrolled (whether in the same plan or a new one) steadily, year after year.
At the same time, new enrollees are added to exchange policies every month via Special Enrollment Periods (SEPs), usually due to losing their existing coverage. Even so, there's always a gradual net attrition of enrollment from the beginning of the year through December, as those dropping exchange coverage outnumber those enrolling via SEPs.
2020, however, is shaping up to be a different story. The COVID-19 pandemic caused millions of people to lose their jobs back in March/April, making those who lost employer-sponsored coverage to become eligible for at least a 60-day SEP (most of the state-based ACA exchanges went further, by effectively re-opening enrollment to anyone whether they lost coverage or not, whle the federal exchange still kept that requirement but backdated the "loss of employer coverage" date to early January.
Of course, there's a difference between the enrollment each month and the average monthly enrollment...and there's also a difference between the first six months of the year and the full year. As Sprung notes in his analysis, even having only half of 2020's data makes it pretty clear that the change vs. 2019 due to the COVID-19 SEPs will be even more dramatic once all twelve months worth of data are available (likely not until this spring, unfortunately). Of course, much of that increase was also cancelled out by current exchange enrollees dropping below subsidized exchange plan status into Medicaid expansion instead.
In the meantime, here's the data which was released today:
Here's the summary:
This report provides average monthly effectuated enrollment and premium data for the individual market Federal and State-Based Exchanges for the first six months of the 2020 plan year. The Centers for Medicare & Medicaid Services (CMS) publishes effectuated enrollment data semiannually to provide a more accurate picture of enrollment trends for the Exchanges than indicated by the number of individuals who selected a plan during Open Enrollment. For coverage to be considered effectuated, individuals generally must pay the first month’s premium for the plan.
As of September 15, 2020, an average of 10.5 million individuals had effectuated their coverage through June 2020. Average effectuated enrollment in the first six months of 2020 was approximately 349,000, or three percent, higher compared to the same time period in 2019.
Similar to past years, the number of individuals who effectuated coverage is lower than the number with plan selections at the end of Open Enrollment. The average number of individuals with effectuated coverage for the first half of 2020 was about 866,000 lower than the number of individuals with plan selections at the end of the 2020 Open Enrollment Period (OEP). This reflects a higher rate of enrollment effectuations from plan selections than last year. That is, effectuated enrollments for the first half of 2020 were 92% of OEP plan selections, up from 89% over the same period in 2019. This higher rate of enrollment is largely due to lower attrition and higher enrollment of consumers through Special Enrollment Periods (SEPs).
Again, no surpise here...hundreds of thousands of people enrolled via COVID-19-caused SEPs nationally (either official COVID SEPs or more "normal" SEPs caused by people losing their employer-based coverage than you'd normally expect during the off-season).
The data released today also show that the average monthly premium per enrollee in the first six months of 2020 was $574.95, a decrease of three percent compared to the first six months of 2019. The average monthly amount of advance payments of the premium tax credits (APTC) per eligible enrollee decreased four percent to $491.30, when compared with the first six months of 2019 average APTC per eligible enrollee. The average premium and average APTC amounts have been relatively stable since the start of the 2020 plan year, as indicated in the Early 2020 Effectuated Enrollment Snapshot. The proportion of total enrollees who received APTC in the first six months of 2020 slightly decreased to 86.4 percent, from 87.0 percent in the first half of 2019.
Background Information
The source for the first half of 2020 average effectuated enrollment is payment and enrollment data. Effectuated enrollment is the average number of individuals who had an active policy at any point from January through June of 2020, and who paid their premium (thus effectuating their coverage) as of September 15, 2020. This report includes effectuated enrollment for both State-Based Exchanges and States using the HealthCare.gov platform.
APTC enrollment is the total number of individuals who had an active policy at any point from January through June 2020, who paid their premium, if applicable, and received APTC. APTC is generally available if an individual's estimated household income is between 100 and 400 percent of the federal poverty level, and certain other criteria are met. An individual was defined as receiving APTC if the applied APTC amount was greater than $0; otherwise, an individual was classified as not receiving APTC.
CSR enrollment is the total number of individuals who had an active policy at any point from January through June 2020, who paid their premium, if applicable, and received cost-sharing reductions (CSR).5 A consumer is generally eligible for CSR if the individual is eligible for APTC, has an estimated household income between 100 percent and 250 percent of the federal poverty level, and is enrolled in a health plan from the silver plan category. American Indians and Alaskan Natives are eligible for CSRs under different criteria.
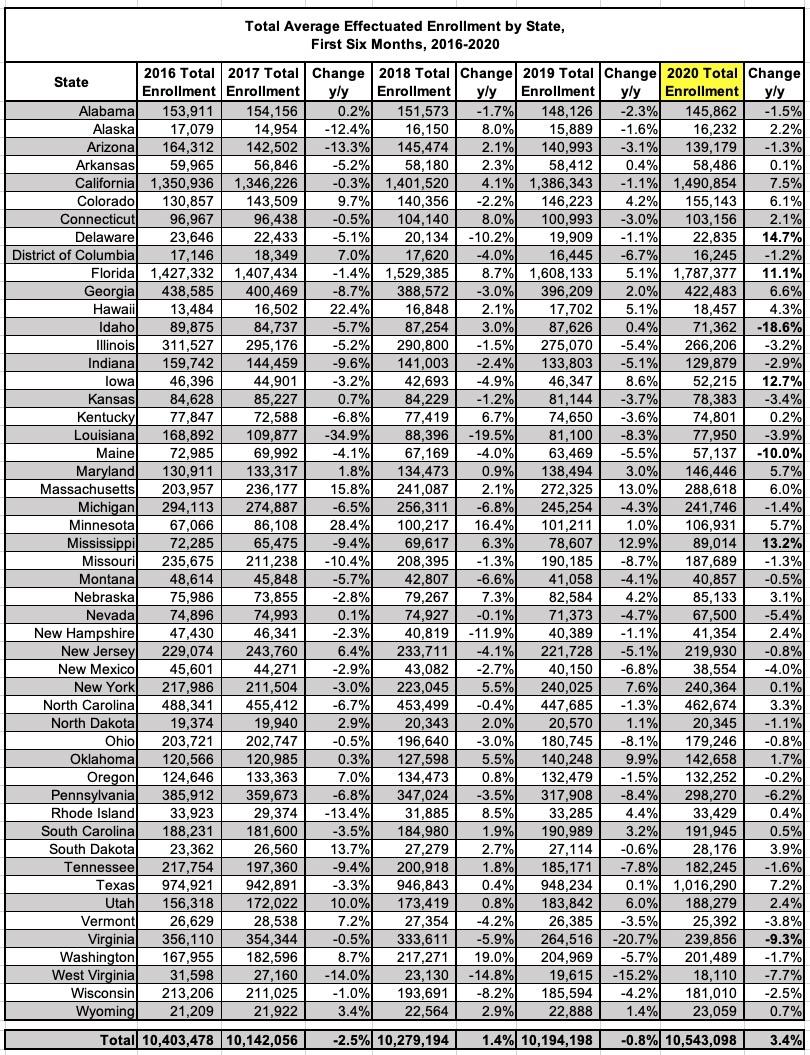
Unfortunately, neither 2014 nor 2015 are included here. 2014 is an outlier in every aspect, not just due to it being the first OEP but also because of the massive technical problems at launch and especially the length (6 months...or really 6 1/2 months depending on your definition) of that first OEP. 2015 would've been nice to have, though.
As you can see, average H1 enrollment dropped 2.5% from 2016 to 2017...but then increased by 1.4% from 2017 to 2018, even though OEP enrollment dropped by 3.8%! How is that possible? Well, the most obvious reason is that OEP 2018 was the first year where the time window was cut in half, from 3 months to 45 days. Even though 465,000 fewer people enrolled, the vast majority of those who did enroll did so in time to have their coverage start in January, as opposed to prior years where a large chunk of enrollees didn't start coverage until February or March. When you're averaging out the first six months of the year, having blank spots for the first one or two months can have a huge impact.
In 2019, the average did drop...but only by 0.8% even though OEP enrollment had dropped by 2.6% (306,000 more people). This time around the OEP time window was the same for both years, but it looks like existing enrollees were "stickier"...more likely to stick it out for the full year instead of dropping out early.
In 2020, as discussed above, the H1 average jumped by a whopping 3.4%, almost certainly due to a a surge of COVID-induced SEPs (and let's face it, existing enrollees who can afford to keep paying premiums are gonna be even more likely to stick with their plan in the middle of a pandemic if they can).
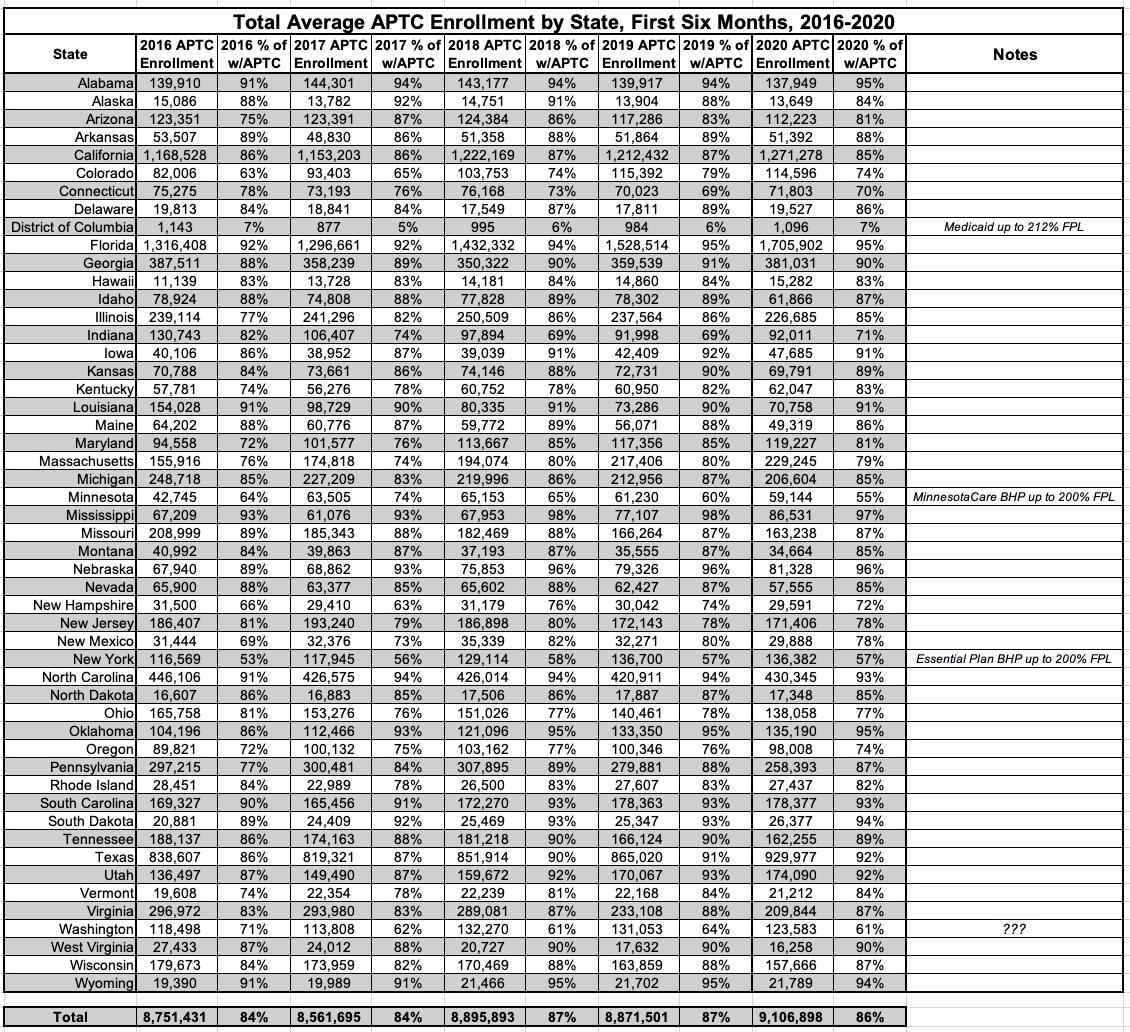
There's not a whole lot noteworthy here over the years, atlhough DC, Minnesota and New York all have much lower percentages of their enrollees qualifying for APTC assistance due to either an unusually high Medicaid eligiblity (DC) or the Basic Health Programs established in MN & NY, both of which cover people up to 200% FPL. One item which does interest me is Washington State, which had a low-but-not-unusual percentage in 2016 (71%) but which has consistently only had around 61-62% of enrollees qualify for APTC assistance since then. I'm not sure what the reason for this is, since WA doesn't have a BHP program nor does their Medicaid expansion go beyond the standard 138% FPL threshold to my knowledge. Huh.
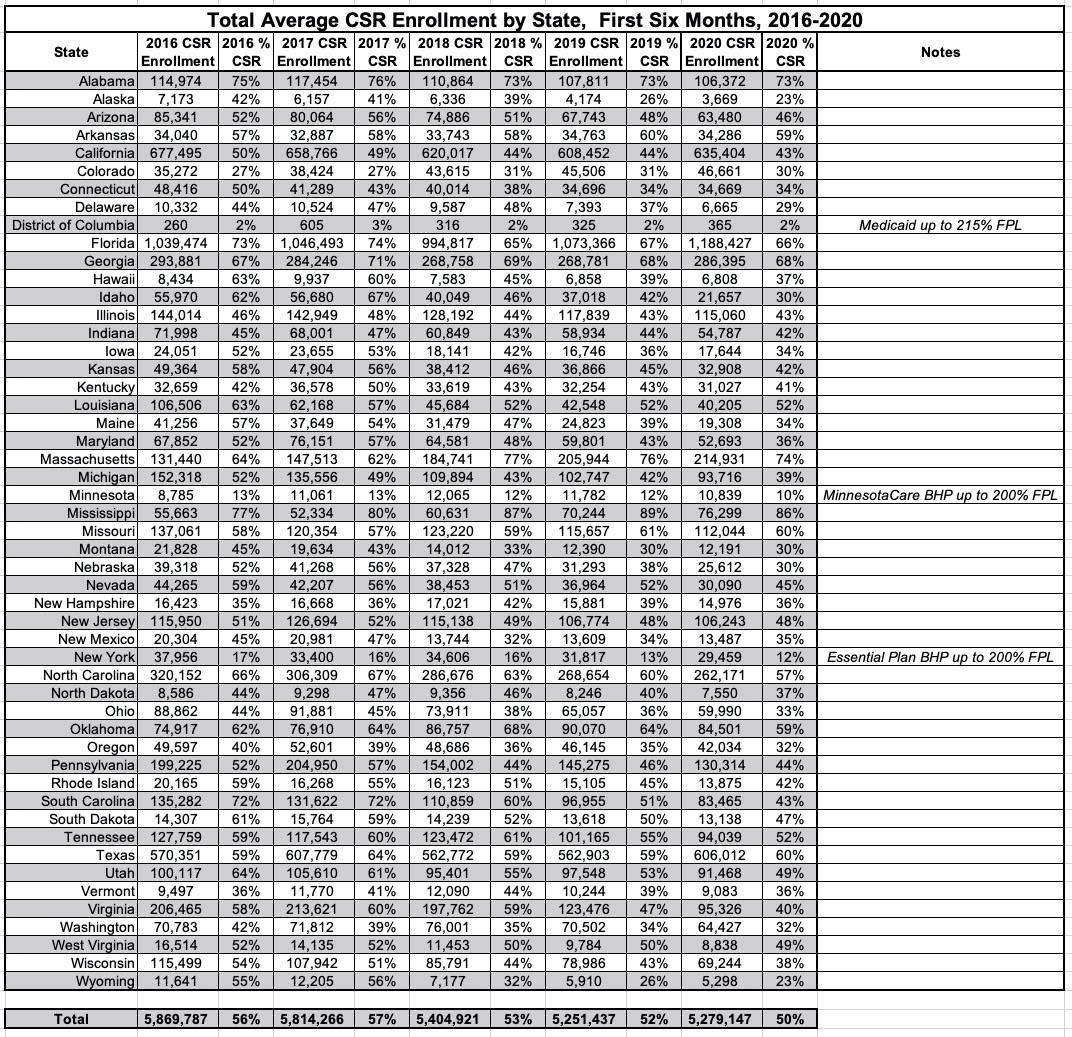
The story is much the same for the monthly average CSR enrollment...it's gradually dropped as a percent of total enrollment over the years from 56% to 50%, with DC, MN & NY again running much lower than average for the same reasons noted above. Oddly, Washington State is not unusually low for CSR even though it is for APTC. Huh.
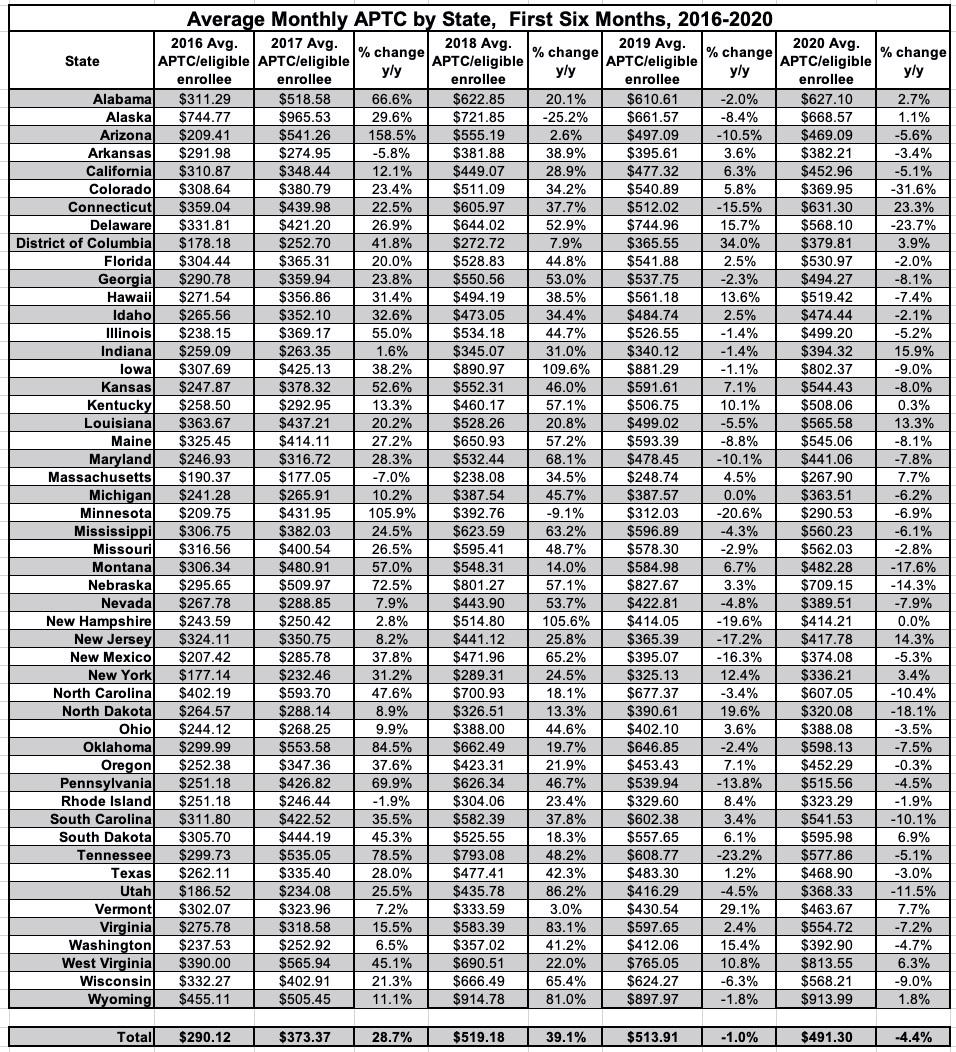
Average unsubsidized premiums skyrocketed in 2017 & 2018 due in large part to Trump Admin sabotage efforts (some of which actually backfired), but were only up a hair in 2019, were basically flat in 2020 and are actually likely to drop slightly in 2021. Naturally, the average subsidy funding enrollees receive has adjusted accordingly as well.
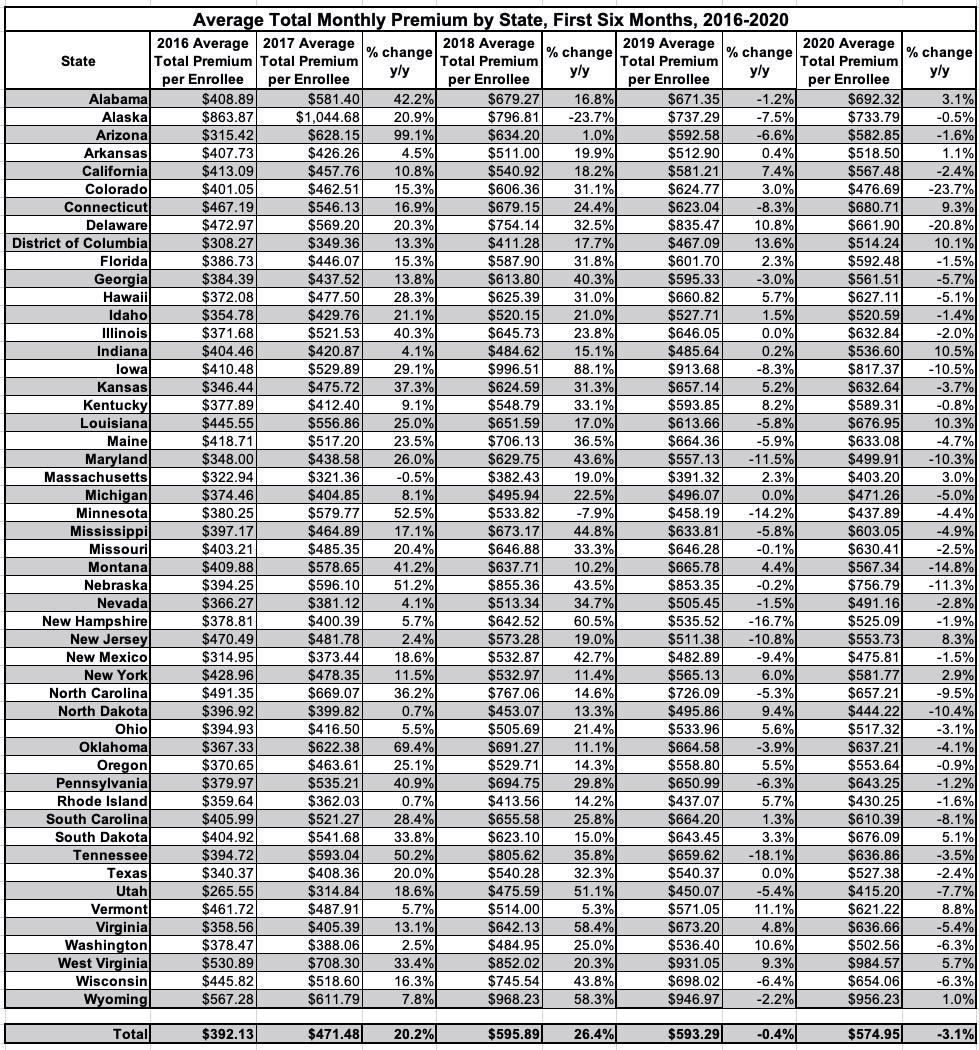
Sure enough, here's the average unsubsidized premiums for all exchange enrollees...they jumped over 20% in 2017 and over 26% in 2018 before flattening out for 2019 and dropping about 3% on average in 2020. Keep in mind that none of these figures include off-exchange ACA-compliant enrollees, though those are making up an increasingly small portion of the ACA market and don't shift the total averages around by much.
Advertisement
