

2021 OEP Week 4 HC.gov Snapshot Report: 523K QHPs, 2.9M total
Thu, 12/03/2020 - 2:06pm
Hot off the presses, via the Centers for Medicare & Medicaid:
Week Four, November 15 - November 28, 2020
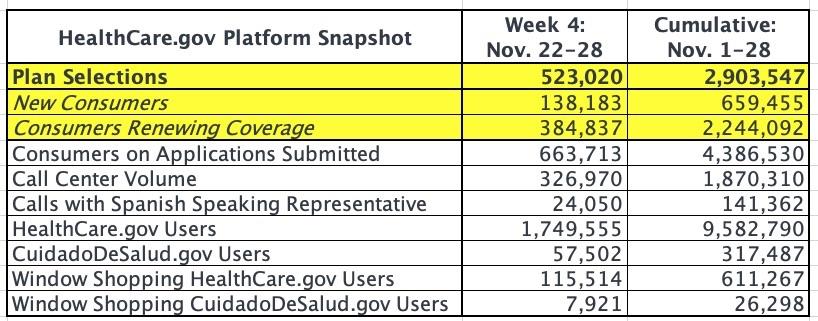
In Week Four of the 2021 Open Enrollment period, 523,020 people selected plans using the HealthCare.gov platform. As in past years, enrollment weeks are measured Sunday through Saturday.
Every week during Open Enrollment, the Centers for Medicare & Medicaid Services (CMS) will release enrollment snapshots for the HealthCare.gov platform, which is used by the Federally-facilitated Exchange and some State-based Exchanges. These snapshots provide point-in-time estimates of weekly plan selections, call center activity, and visits to HealthCare.gov or CuidadoDeSalud.gov.
The final number of plan selections associated with enrollment activity during a reporting period may change due to plan modifications or cancellations. In addition, the weekly snapshot only reports new plan selections and active plan renewals and does not report the number of consumers who have paid premiums to effectuate their enrollment.
As a reminder, New Jersey and Pennsylvania transitioned to their own State-based Exchange platforms for 2021, thus they are not on the HealthCare.gov platform for 2021 coverage. Those two states accounted for 578,251 plan selections or 7% of all plan selections during the 2020 Open Enrollment Period. These enrollees’ selections will not appear in our figures until we announce the State-based Exchange plan selections.

It's a bit tricky to compare the first weekly report against the previous year because the snapshot reports run Sunday - Saturday. Last year Nov. 1st fell on a Friday, so "Week 1" was actually only 2 days; "Week 2" included the following 7 days, for 9 days total; "Week 3" included just 16 days total and "Week 4" included 23 days.
There's nothing surprising about the drop-off from Week 3...Thanksgiving Week always sees a significant drop as people aren't generally in the mood to buy health insurance during a big holiday weekend. Even so, HC.gov is still doing better than last year.
With the fourth week included, I can compare 28 days in OEP 2021 vs. 30 days in OEP 2020, which is still apples to oranges but a lot closer. So far the 2021 season is running 7.0% higher than last year on a daily basis:
- First 28 days of OEP 2021: 103,698 QHP selections/day (2,903,547 total)
- First 30 days of OEP 2020: 96,900 QHP selections/day (2,876,998 total)
Keep in mind, however, that this is if you include Pennsylvania and New Jersey! Those two states enrolled a total of 178,188 people in the first 30 days last year, so it's actually:
- First 28 days of OEP 2021: 103,698 QHP selections/day (2,903,547 total)
- First 30 days of OEP 2020 (w/out NJ/PA): 89,927 QHP selections/day (2,697,810 total)
...or 15.3% higher per day than last year, which is pretty good, especially under the circumstances (the pandemic, the looming Supreme Court decision and the ongoing coup attempt by Donald Trump to overthrow the election results).
However, it's also important to note the breakout between current enrollees actively renewing their policies and new consumers enrolling.
Last year, in the first 30 days, it was a 73% / 27% split between the two. This year, for the first 28 days it's split 77/23.
Renewals of existing enrollees are way up: 2,244,092 vs. around 1,980,497 last year (when adjusted for NJ/PA), or 80,146/day vs. 66,016/day. That's 21.4% higher.
NEW enrollment, however, is concerning. Last year there were 764,956 new enrollees via HC.gov in the first 30 days. If you adjust for NJ/PA splitting off, that's around 711,000, or 23,690 new enrollees per day. This year it's just 659,455 in 28 days, or 23,552 per day...slightly fewer per day.
Given the massive number of people who have lost their employer-sponsored health insurance since March, you'd normally think that there'd be a surge in new enrollees, especially since many parts of the country have zero premium policies...including zero-premium GOLD plans for many people. And yet, so far, the number of new enrollees is pretty much flat.
This is where a proper awareness/marketing/outreach campaign from the federal government could do wonders...yet Trump's CMS Administrator, Seema Verma, has basically gutted HC.gov's marketing budget.
UPDATE: Andrew Sprung made an obvious point (which I feel stupid about missing, since I was tracking this so closely earlier this spring/summer): A big chunk of the surge in renewals could also simply be people who enrolled via Special Enrollment Periods (SEPs) earlier this year who are renewing. Even if they've only been enrolled for a month or two, they're still considered current enrollees, not new enrollees.
He also reminded me that a chunk of current exchange enrollees likely had to downshift to Medicaid instead if they lost their jobs/income...meaning the net impact on total exchange enrollment could be pretty minimal.
In addition, here's the state-level breakout for the 36 states hosted via HC.gov. I've included last year's "Week 5" (30 day) numbers for comparison, and have adjusted them to account for the 2 missing days this year to get an idea of how each state is performing year over year so far:
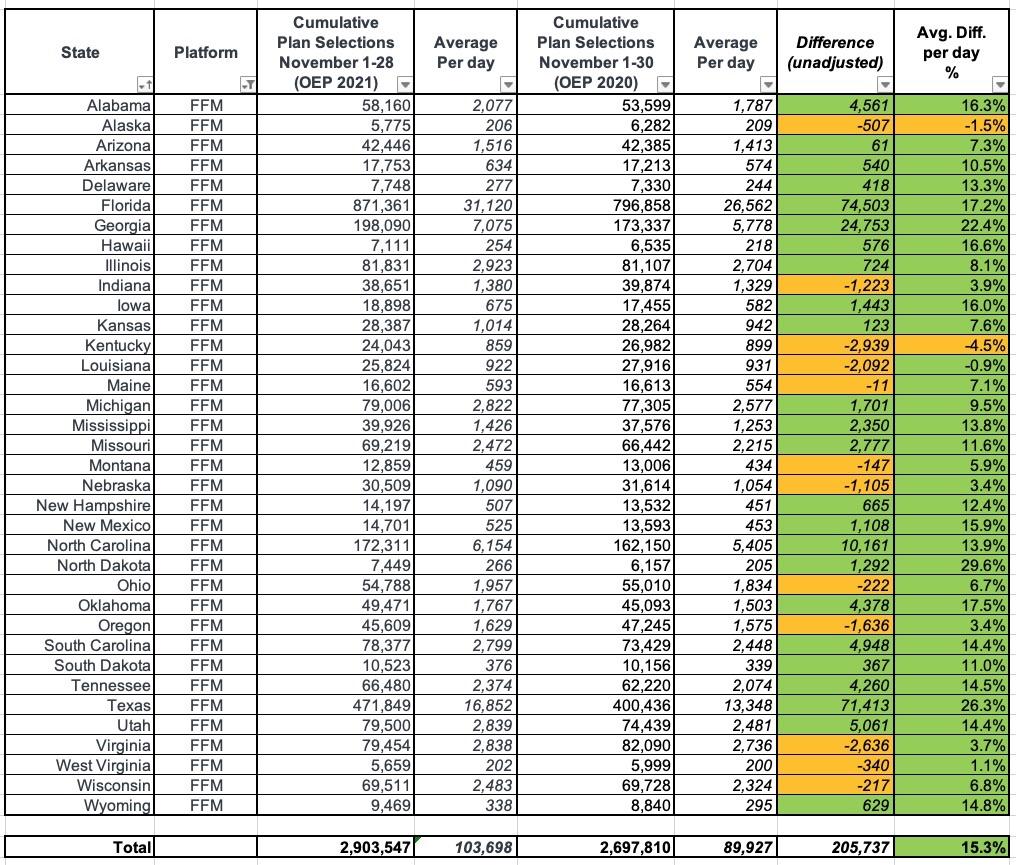
As you can see, on a per-day average basis, 34 out of 36 states are outperforming last year so far. The highest increase remains North Dakota, which is up 29.6% year over year. The worst-performing state relative to last year is still Kentucky, which is down 4.5% year over year on a per-day basis for reasons unknown.
Advertisement
