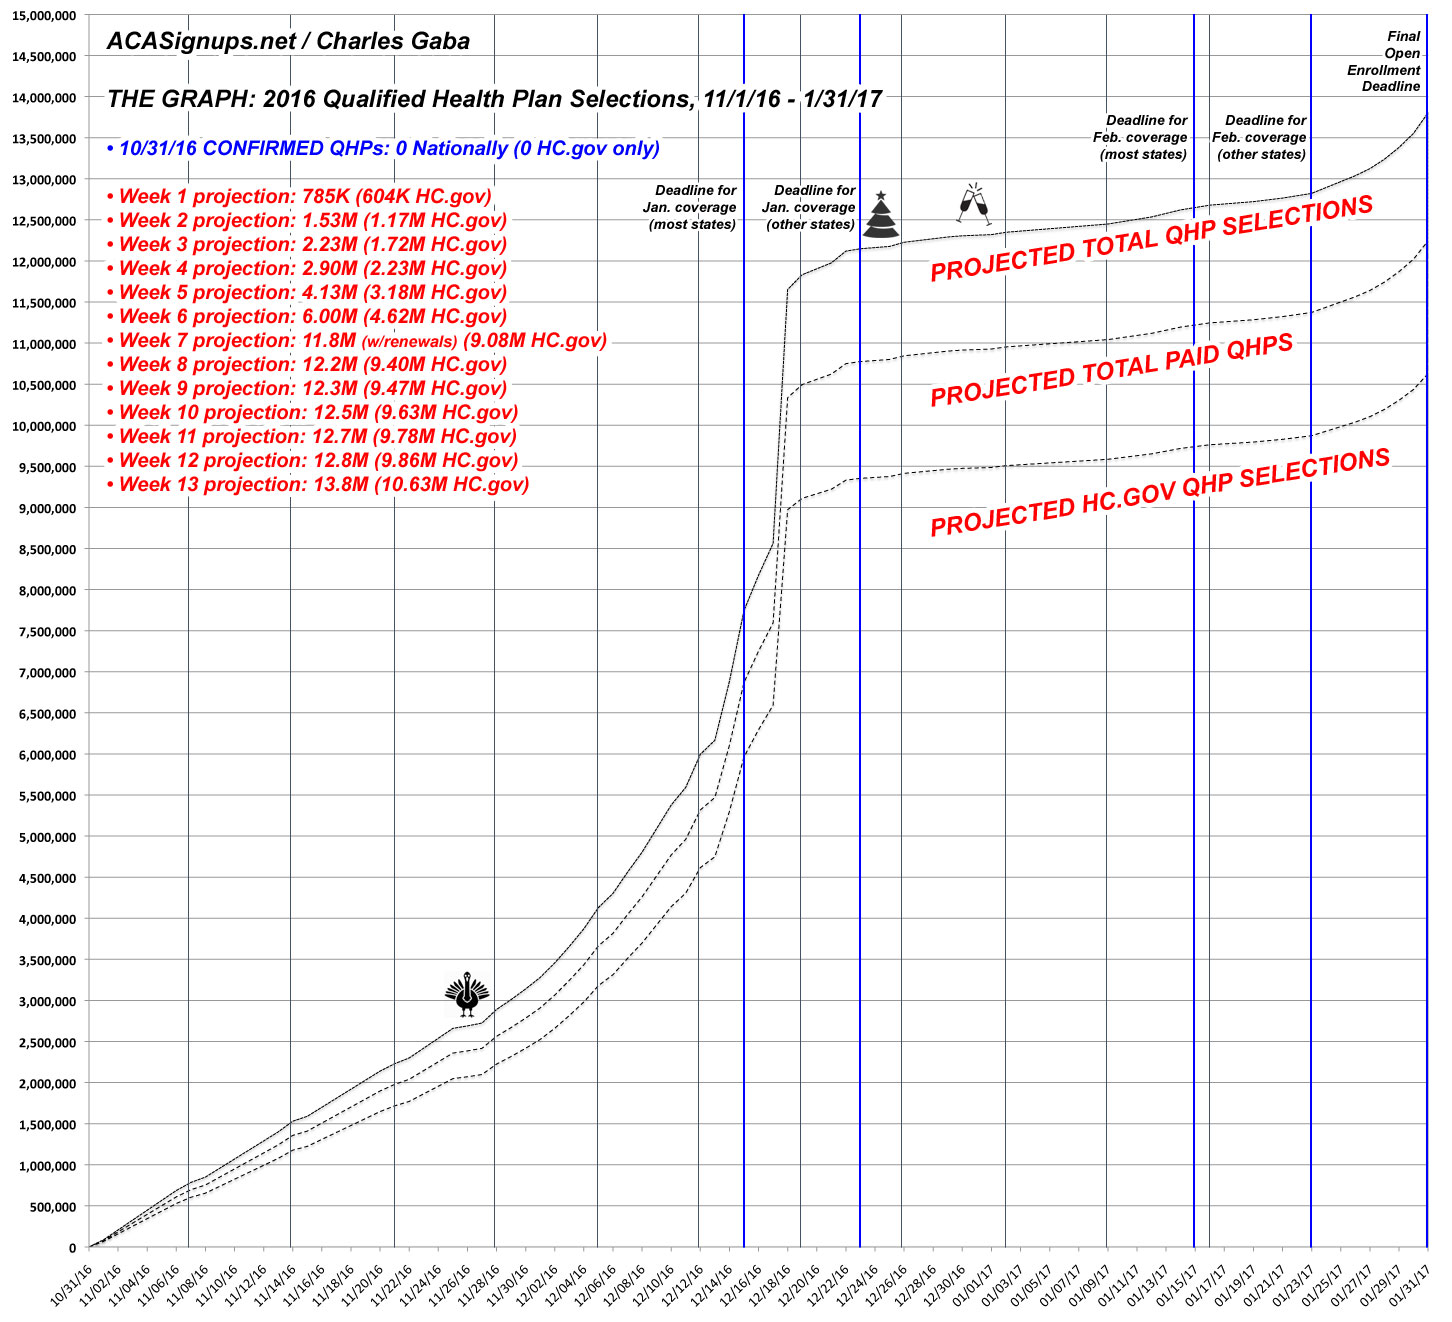
THE GRAPH IS BACK, BABY!!
OK, now that both HHS and I agree that the ACA exchange target for the 2017 Open Enrollment Period is around 13.8 million QHP selections, it's time to dust off The Graph and reset it for 2017.
It was fairly easy to do so this time because this is the first year that the starting and ending dates match (November 1st to January 31st). All I really had to do was bump up the 1/31/17 projection from 12.7 million to 13.8 million, and the rest of the projection line adjusted accordingly.
With that in mind, here's how I expect things to play out for Year 4 (click below for a higher-res version):
Some important notes to keep in mind:
- In most states, you have to enroll by the 15th of the month in order to have your coverage kick in on the 1st of the following month, but in the past a few states like Massachusetts have given an extra 8 days. I'm not sure if this is still the case this year; if not, 2 of those blue vertical lines will be removed.
- While the start and end dates are identical, the days of the week don't match up. Since enrollments tend to drop off on weekends, there's a few points which might not quite match.
- Assuming CMS provides their weekly "snapshot reports" again this year, they generally are released a few days after that week, so the confirmed QHPs will be shifted a few days later than the actual projection line.
- See that huge spike right around December 18th-19th? That's HHS plugging in the autorenewals for several million current HC.gov-state enrollees. the exact date may vary, but they'll likely do it a few days after the first big December 15th deadline passes.
- For the first week, I expect roughly 600,000 people to enroll via the federal exchange (HC.gov).
Now, it's important to note that even if Week 1 doesn't hit 600K, that doesn't necessarily mean that the final tally won't hit 13.8 million. Things could pick up more than expected a week or two later, or the number of autorenewals could be higher than projected, or any number of other variables. However, assuming 2017 plays out similarly to the previous 2 years, the pattern above is how I would expect things to play out this year.
The Graph will, as always, be updated daily starting on 11/01/16 at this link.


